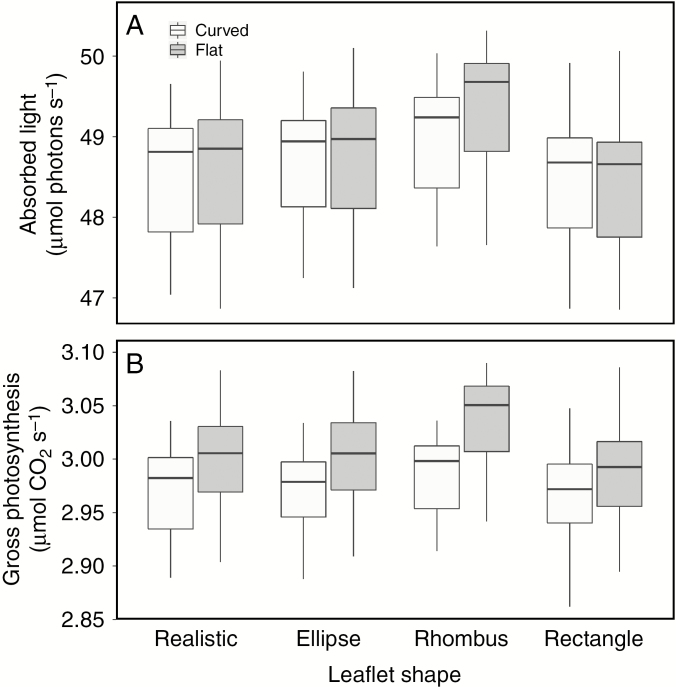
Fig. 6.
Simulated results of total per-plant (A) light absorption and (B) gross photosynthesis of the two centremost plants in the virtual glasshouse (n = 20). These two plants were surrounded by border plants in order to minimize border effects. The four different leaflet shapes are compared, both as flat and as curved objects.

