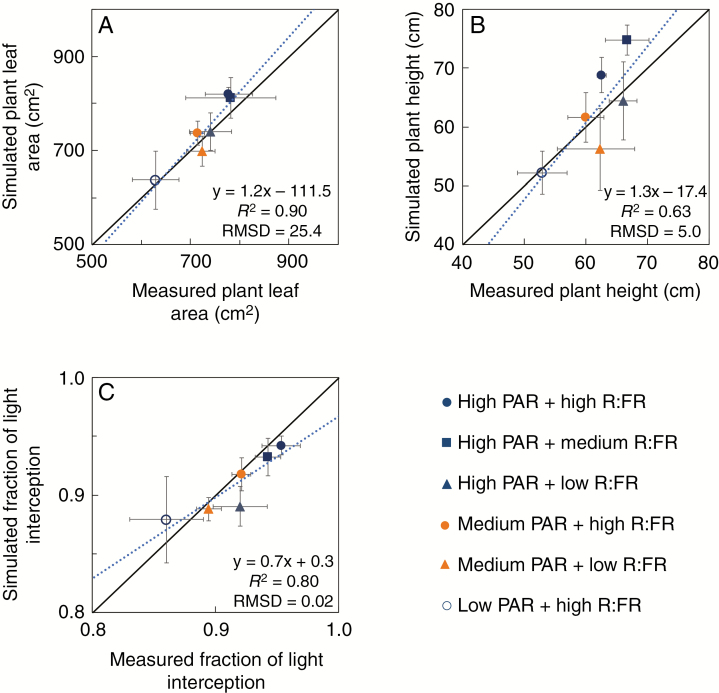
Fig. 1.
Comparisons between measured and simulated results of (A) plant total leaf area, (B) plant height and (C) the fraction of light intercepted by the plants in different photosynthetically active radiation (PAR) and red to far-red ratio (R:FR) treatments. The equation in each panel represents the linear regression of simulated (y) vs. measured (x) values. R2 is the determination coefficient of the linear regression. RMSD is the relative root-mean-square deviation. Solid lines are 1:1 lines. Dotted lines are linear regression lines. Error bars are standard deviations.

