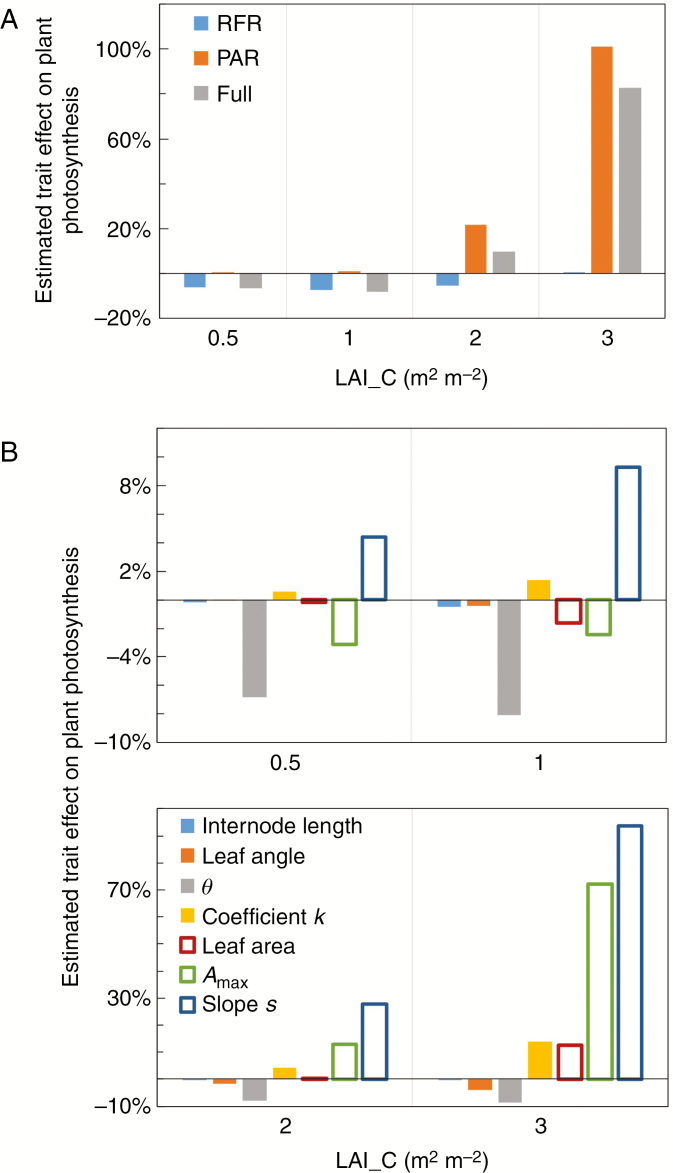
Fig. 4.
Estimated effects of (A) the combination of traits and (B) individual traits on plant photosynthesis under canopy shading caused by a leaf area index (LAI_C) of 0.5, 1, 2 and 3 m2 m−2. Trait effects are calculated as the relative changes of plant photosynthesis by changing targeted traits compared with plant photosynthesis of non-shaded plant phenotype (see eqn 5 for the calculation). In A, ‘RFR phenotype’ represents the phenotype that all trait responses to reduced red to far-red ratio (R:FR) are changed simultaneously, ‘PAR phenotype’ represents the phenotype that all trait responses to reduced photosynthetically active radiation (PAR) are changed simultaneously, and ‘Full phenotype’ represents the phenotype that all trait responses to both reduced R:FR and reduced PAR are changed simultaneously. In B, solid bars are trait responses to reduced R:FR, while open bars are trait responses to reduced PAR.

