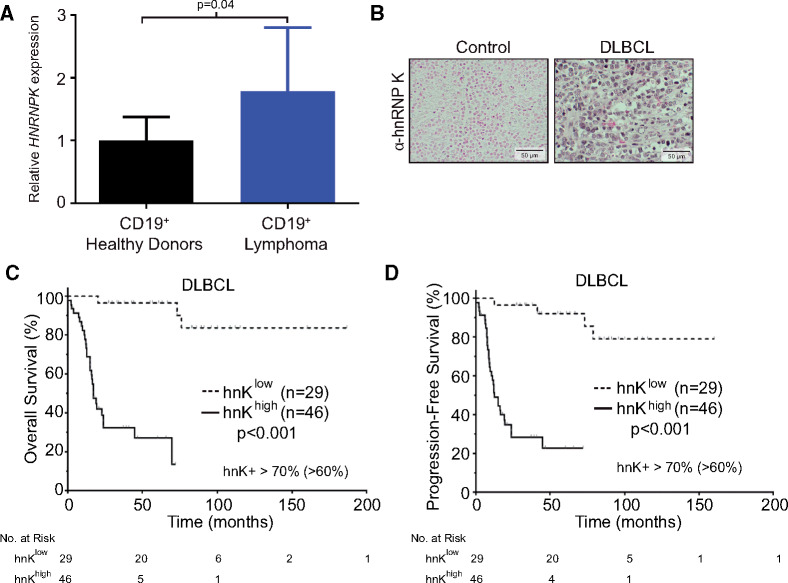
Figure 1.
hnRNP K expression levels in DLBCL patient samples. A) Quantitative RT-PCR analysis of HNRNPK levels in CD19+ B cells isolated from patients with lymphoma (n = 15) and healthy donors (n = 9). Data are represented as the mean ± SD as determined from triplicate samples after normalization to GAPDH expression. P values were calculated using a two-sided Student t test. B) Immunohistochemical analyses of hnRNP K levels in activated lymph nodes of healthy donors (tonsils) and in lymph nodes of patients with DLBCL. The scale bar represents 50 µm. C) Kaplan-Meier curve representing overall survival of patients with DLBCL based on high hnRNP K expression (n = 46) compared with patients with weak or low expression (n = 29). Statistical significance was determined by a two-sided log-rank test. D) Kaplan-Meier curve representing progression-free survival of patients with DLBCL based on high hnRNP K expression (n = 46) compared with patients with weak and/or low expression (n = 29). Statistical significance was determined by a two-sided log-rank test. DLBCL = diffuse large B-cell lymphoma; hnK = heterogeneous nuclear ribonucleoprotein K (hnRNP K); RT-PCR = reverse transcription polymerase chain reaction.

