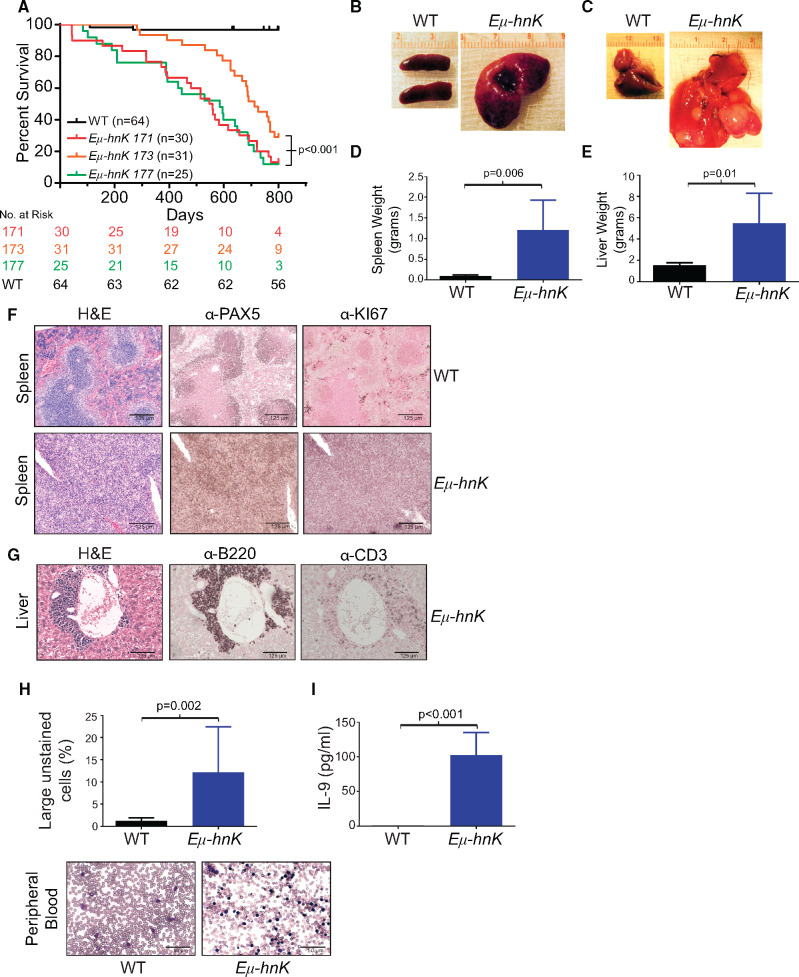
Figure 3.
Phenotypic characterization of Eµ-Hnrnpk transgenic mice. A) Kaplan-Meier curves indicating survival of Eµ-Hnrnpk lines 171 (n = 30), 173 (n = 31), 177 (n = 25), and wild-type (n = 64) mice. Statistical significance was determined by a two-sided log-rank test. Representative photos of spleens (B) and livers (C) from Eµ-Hnrnpk and wild-type mice. D) Bar graphs depicting spleen (D) and liver (E) weights from Eµ-Hnrnpk and wild-type mice. Data are represented as the mean ± SD. P values were calculated using a two-sided Student t test. F) H&E and immunohistochemical staining of splenic sections from wild-type and disease-burdened Eµ-Hnrnpk mice with PAX5 (B-cell marker) and Ki67 (proliferation marker). The scale bar represents 125 µm. G) H&E and immunohistochemical staining of livers with B-cell infiltrates from Eµ-Hnrnpk mice diagnosed with lymphoma (B220+/CD3-). The scale bar represents 125 µm. H) Bar graph representing large unstained cells (LUC) from peripheral blood of Eµ-Hnrnpk (n = 23) and wild-type (n = 10) mice. Data are represented as the mean ± SD. P values were calculated using a two-sided Student t test. Wright-Giemsa staining of representative peripheral blood from Eµ-Hnrnpk and wild-type mice. The scale bar represents 50 µm. I) Bar graph representing cytokine concentrations of interleukin-9 (IL-9) in the peripheral blood of wild-type (n = 4) and Eµ-Hnrnpk mice (n = 6) diagnosed with lymphoma. Data are represented as the mean ± SD. P values were calculated using a two-sided Student t test. H&E = hematoxylin and eosin; hnK = heterogeneous nuclear ribonucleoprotein K (hnRNP K); WT = wild-type.

