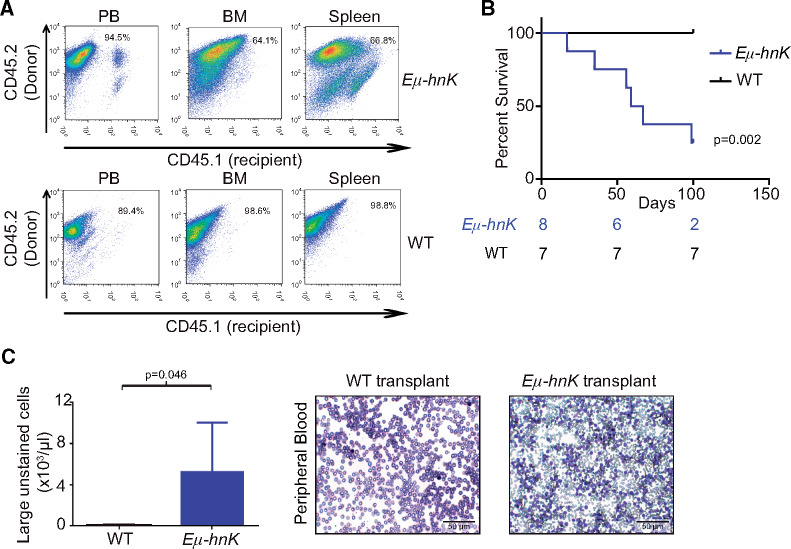
Figure 4.
Transplantation of Eµ-Hnrnpk cells in mice. A) Flow cytometry analysis of CD45.1+ (recipient) and CD45.2+ (donor) hematopoietic cells in the peripheral blood (left panels), bone marrow (center panels), and spleen (right panels) of recipient mice following transplantation of cells from Eµ-Hnrnpk (top panels) and wild-type (bottom panels) mice. B) Kaplan-Meier curves indicating survival of NSG mice transplanted with either Eµ-Hnrnpk (n = 8) or wild-type (n = 7) cells. Statistical significance was determined by a two-sided log-rank test. C) Bar graph representing the population of large unstained cells (LUC) from complete blood count analyses of NSG mice transplanted with cells from Eµ-Hnrnpk (n = 4) and wild-type (n = 4) mice. Data are represented as the mean ± SD. P values were calculated using a two-sided Student t test. Wright-Giemsa staining of representative peripheral blood from NSG mice transplanted with cells from Eµ-Hnrnpk or wild-type mice. The scale bar represents 50 µm. BM = bone marrow; NSG = NOD scid gamma; PB = peripheral blood; WT = wild-type.

