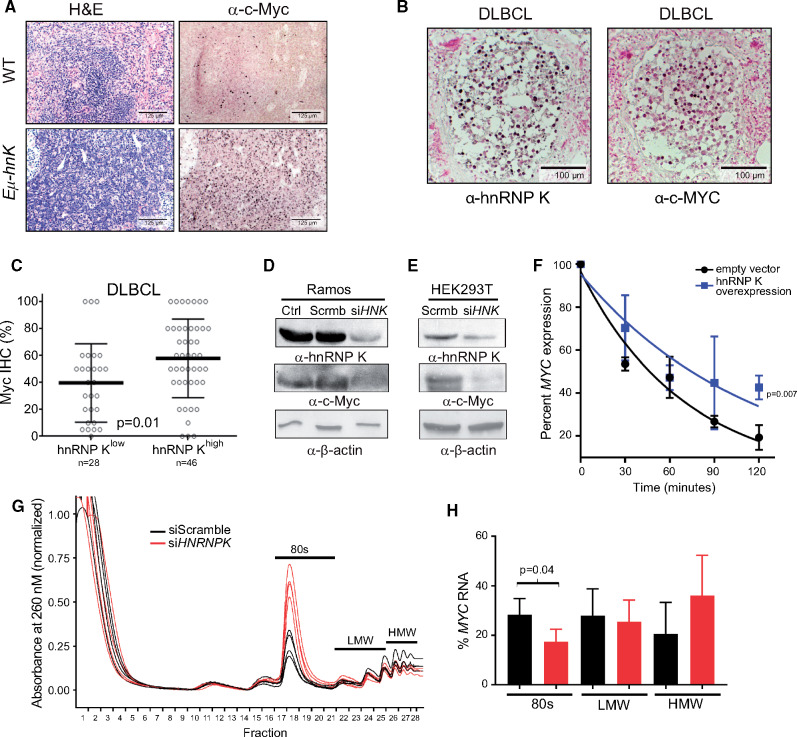
Figure 6.
Assessing hnRNP K’s impact on c-Myc expression. A) H&E and immunohistochemical analyses of c-Myc levels in spleen samples isolated from wild-type and Eµ-Hnrnpk mice. The scale bar represents 125 µm. B) Immunohistochemical analyses of hnRNP K and c-Myc levels in lymph nodes and bone marrow of DLBCL patients. The scale bar represents 100 µm. C) Bar graph representing c-Myc protein as function of high (n = 46) or low (n = 28) hnRNP K in patients with DLBCL without concomitant MYC alterations. Error bars represent SD from the mean. P values were calculated using a two-sided Student t test. D and E) Immuno blot analyses of hnRNP K and c-Myc expression following siRNA-mediated knockdown of hnRNP K (siHNK) or scrambled si-RNAs (Scrmb) in Ramos and HEK293T cells. β-actin expression serves as a loading control. F) Graph representing MYC transcript levels in 293T cells transfected with control and Flag-hnRNP K plasmids on actinomycin treatment. RPLP0 serves as an internal control. All time points were performed in triplicate. P values were calculated using a two-sided Student t test. G) Polysome assay trace for 293T cells transfected with siScramble or siHNRNP K on a 0%–50% sucrose gradient. H) Graph representing percent MYC mRNA levels in various ribosomal components as determined by qRT-PCR. Data are represented as the mean ± SD. P values were calculated using a two-sided Student t test. DLBCL = diffuse large B-cell lymphoma; H&E = hematoxylin and eosin; HMW = high molecular weight; hnRNP K = heterogeneous nuclear ribonucleoprotein K; IHC = immunohistochemistry; LMW = low molecular weight; qRT-PCR = quantitative reverse transcription polymerase chain reaction; WT = wild-type.

