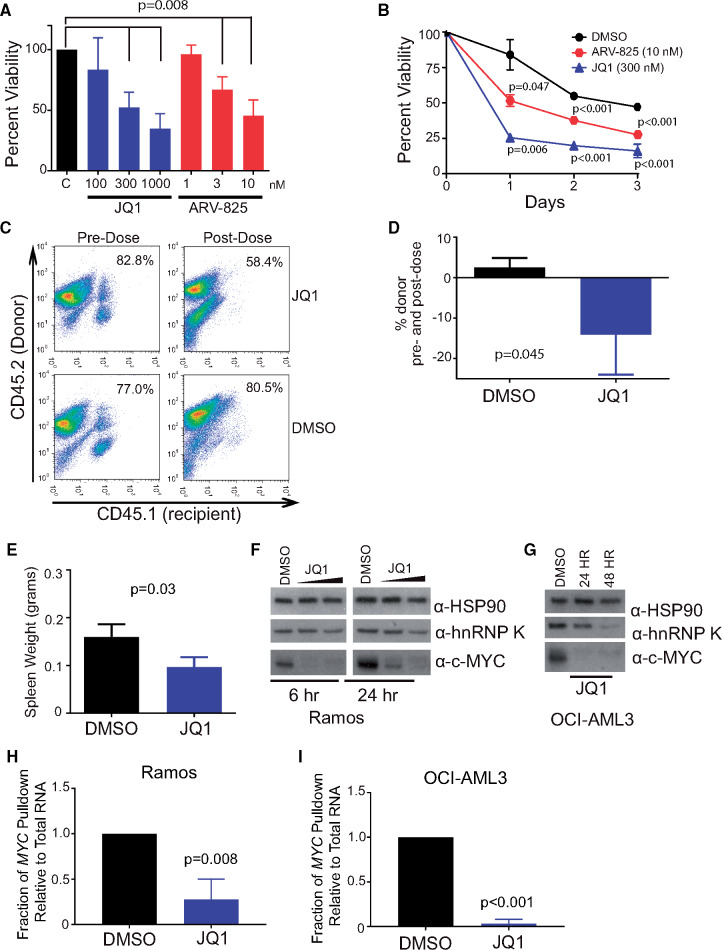
Figure 7.
Utility of bromodomain inhibitors in hnRNP K-dependent lymphomas. A) Bar graph depicting cell viability in splenocytes isolated from tumor-burdened Eµ-Hnrnpk mice (n = 5) following treatment with increasing doses of JQ1 (100, 300, and 1000 nM) and ARV-825 (1, 3, and 10 nM). Data are represented as the mean ± SD. Samples were compared with their corresponding DMSO controls to obtain P values, which were calculated using a two-sided Mann-Whitney test. B) Viability of splenocytes isolated from tumor-burdened Eµ-Hnrnpk mice (n = 3) following treatment with JQ1 (300 nM) and ARV-825 (3 nM) for 24, 48, and 72 hours. Data are represented as the mean ± SD. Samples were compared with their corresponding DMSO controls to obtain P values, which were calculated using a two-sided Student t test. C and D) Flow cytometry analysis of CD45.1+ (recipient) and CD45.2+ (donor) hematopoietic cells in the peripheral blood before (left panels) and after (right panels) following JQ1 treatment (top panels) and DMSO (bottom panels). Data are represented as the mean ± SD. P values were calculated using a two-sided Student t test. E) Bar graph depicting the splenic weight of transplanted NSG mice following JQ1 or vehicle treatment. Data are represented as the mean ± SD. P values were calculated using a two-sided Student t test. F and G) Immuno blot analysis of hnRNP K and c-Myc levels on JQ1 treatment in Ramos and OCI-AML3 cells, respectively. H and I) Bar graphs showing the amount of MYC immunoprecipitated by hnRNP K on DMSO or JQ1 treatment in Ramos and OCI-AML3 cells, respectively. Data are represented as the mean ± SD, after normalization to internal control RPLP0, as determined from four samples. P values were calculated using a two-sided Student t test. DMSO = dimethyl sulfoxide; hnRNP K = heterogeneous nuclear ribonucleoprotein K.

