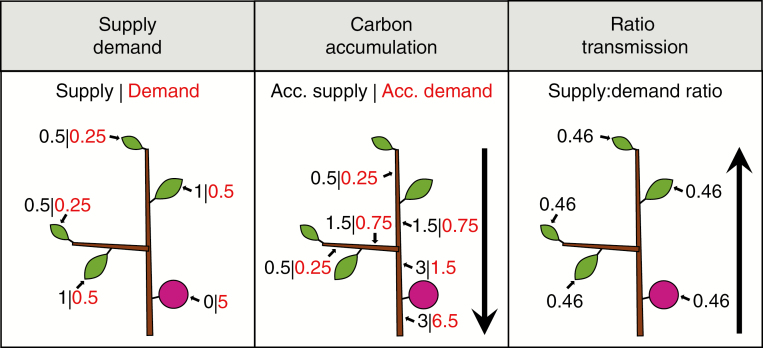
Fig. 1.
Visualization of the simulation process in AUCAM showing: (Supply Demand) carbon supply, i.e. photosynthesis, and demand for each leaf and fruit; (Carbon accumulation) basipetal accumulation of carbon supply and demand for each internode; (Ratio transmission) calculation of the supply:demand ratio (3/6.5 = 0.46) in the basal internode, as well as acropetal transmission of the ratio to the whole autonomous unit.

