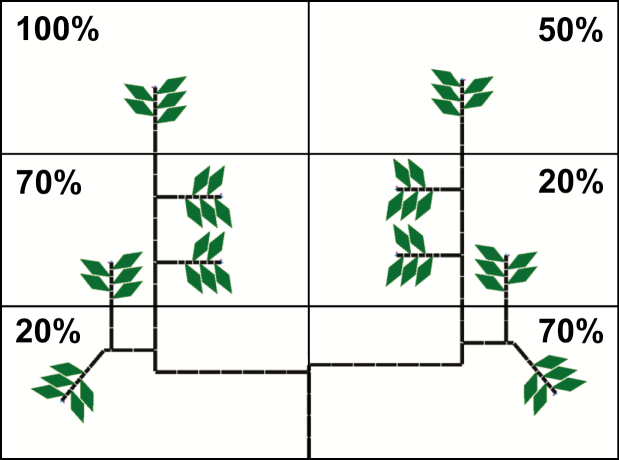
Fig. 3.
Representation of an initial simple tree canopy and a heterogeneous light distribution by dividing the space into different PAR levels (rectangles). Each value represents the percentage of light incident with respect to the PAR above the canopy. The left side of the canopy had on average higher PAR than the right side.

