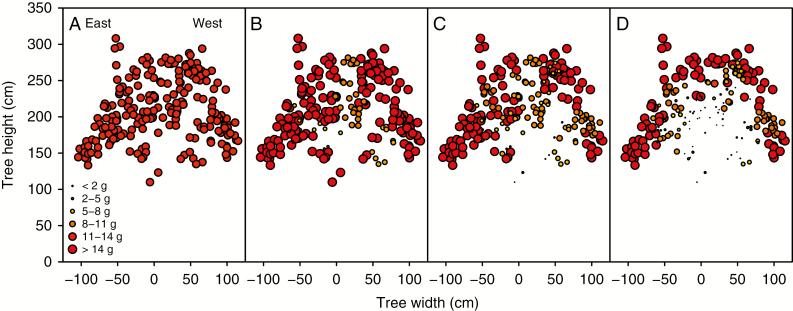
Fig. 7.
Distribution of yield per shoot with different carbon autonomy scales in a macadamia tree canopy: (A) no autonomy, (B) limbs, (C) branch and (D) branchlet. Only yield produced in a section between 30 cm towards north and 30 cm towards south from the centre of the tree is plotted. Each point is the dry weight of three racemes with four fruits each. Point size and colour denote yield intervals of individual shoots.

