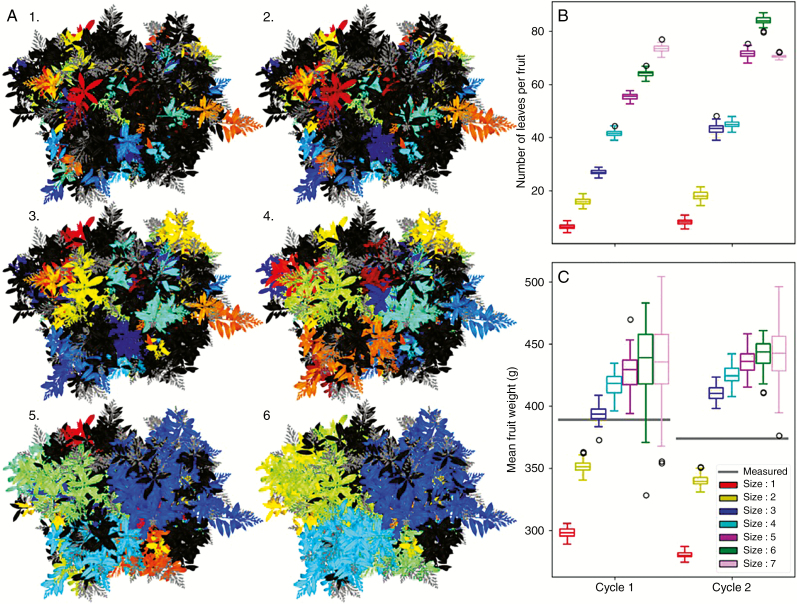
Fig. 9.
Testing the effects of different fruiting branch size on fruit growth. A fruiting branch of size N is defined as the set of GUs located at a maximal distance in the structure of N GUs from a fruiting GU. (A) Top views of a mango tree with fruiting branches of size 1–6. Different colours are used to identify the different fruiting branches. Non-fruiting inflorescences are in grey and growth units of non-fruiting branches are in black. (B) Distribution of the computed leaf:fruit ratio for each size of the fruiting branches during each simulated cycle. The leaf:fruit ratio is a main parameter controlling fruit growth. (C) The average fruit fresh mass simulated with different fruiting branch sizes compared with the measured ones (grey lines) during each simulated cycle. For graphs (B) and (C), boxplots represent the distribution of the average leaf:fruit ratio and of fruit fresh mass for 1000 simulations of three mango trees, respectively.

