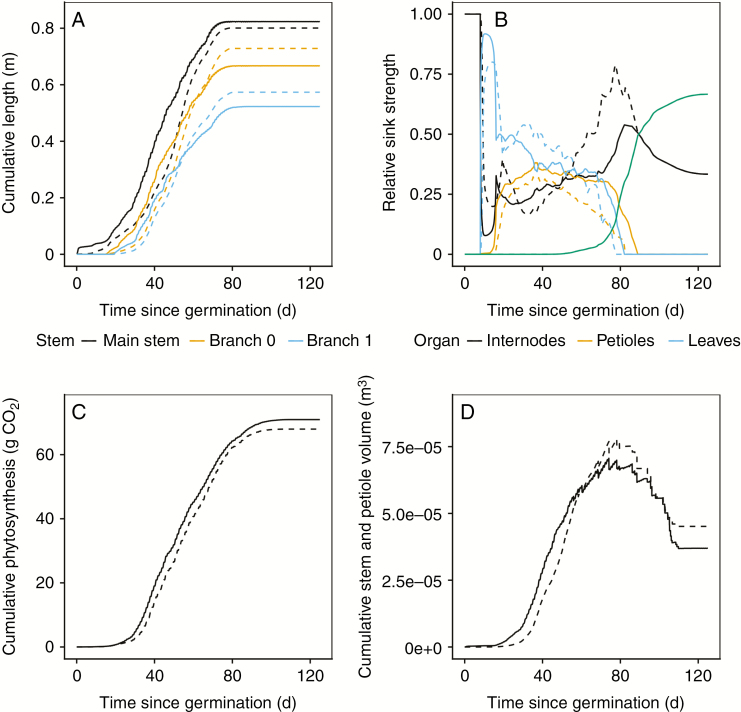
Fig. 3.
Comparison of the turgor-driven soybean FSPM (continuous lines) with calibrated parameter values (Supplementary Data S6) with the descriptive model obtained directly from measured data (S2, dashed lines). (A) Cumulative length of the main stem and branches originating on the hypocotyl (branch 0) and unifoliate phytomer (branch 1). (B) Temporal sink functions describing the relative resource allocation over time. The function of the descriptive model (Supplementary Data S2) was rescaled using the seed sink strength of the predictive model as no temporal measurements of the seeds were taken and thus included in the descriptive model. (C) Cumulative photosynthesis, which is directly related to the temporal development of leaf area, as the timings of leaf spectral characteristics, phenology and leaf angle development are equal in the two models. (D) Evolution of stem and petiole volume. The sudden decreases in this graph are due to shedding of senesced leaves (and petioles). At full senescence, the remaining value shows only the final internode volume.

