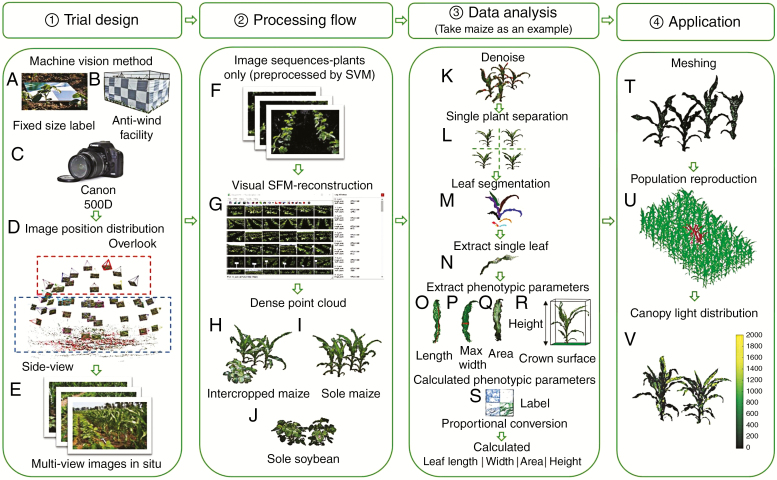
Fig. 1.
Pipeline of photography process, canopy reconstruction, phenotypic traits extraction and meshing. (A–E) represent trial design, (F–J) represent the process of 3-D reconstruction, (K–S) represent the flow of data analysis, (T–V) represent meshing and the process of calculating canopy light distribution.

