Fig. 2.
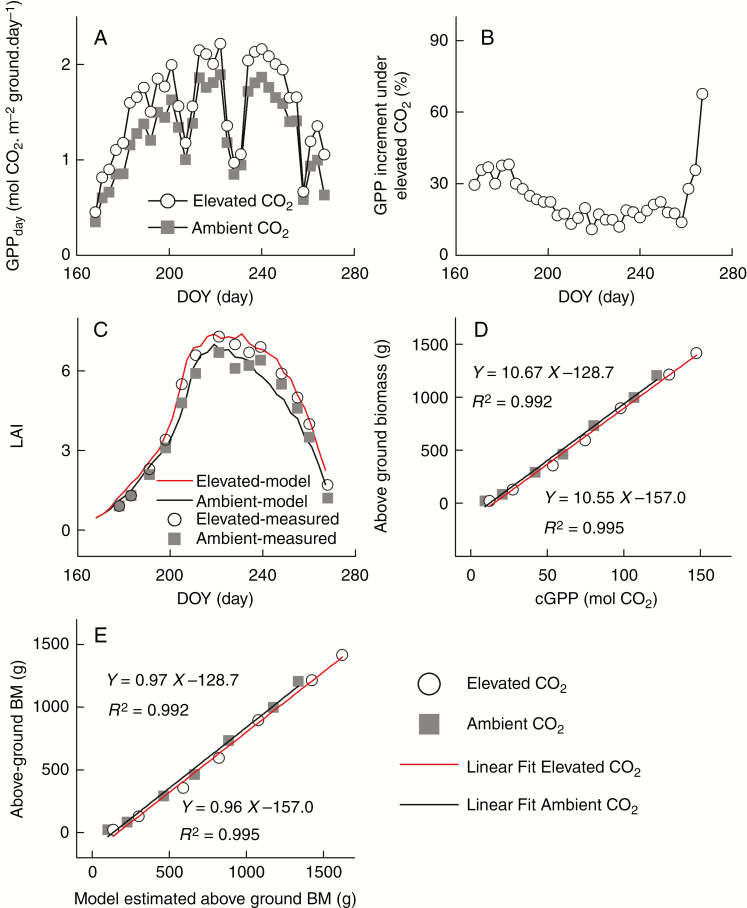
(A) Daily GPP of a soybean canopy (GPPday) under either elevated or ambient [CO2] conditions. (B) Relative increase of GPP under elevated [CO2] condition as compared to the ambient [CO2] condition. GPP in A and B was model-simulated. (C) Leaf area index (LAI) simulated using the canopy models, as compared to the measured data (Dermody et al., 2006) for soybean grown under elevated [CO2] and ambient [CO2] conditions. (D) Correlation between above-ground biomass (Morgan et al., 2005) and calculated cumulative GPP (cGPP) at different stages. The R2 of linear fitting was > 0.99 for both ambient [CO2] and elevated [CO2] conditions. (E) Correlation between the measured above-ground biomass and model-estimated above-ground biomass from cGPP.

