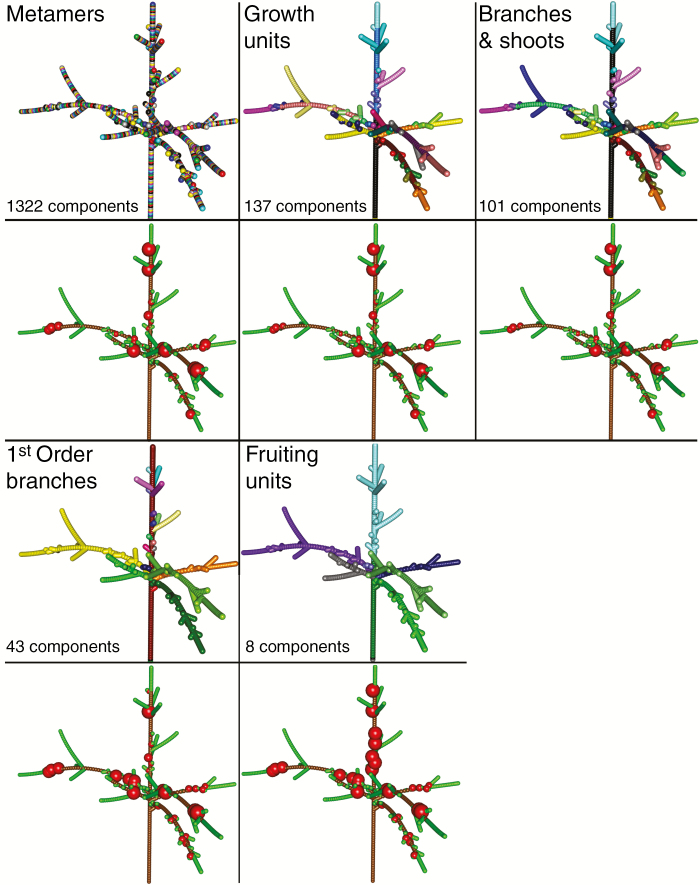
Fig. 3.
Simulation of C allocation and fruit growth on a tree structure represented at different spatial scales during one day. (First and third rows) Tree parts represented with the same colour belong to the same scale, i.e. trees with a higher number of colours have a higher number of components. The number of components at each scale is indicated in the corresponding lower left corner. (Second and fourth rows) The volume of the represented spheres is proportional to the normalized increment in fruit dry weight within the tree. Simulations were run with a friction parameter equal to 8.

