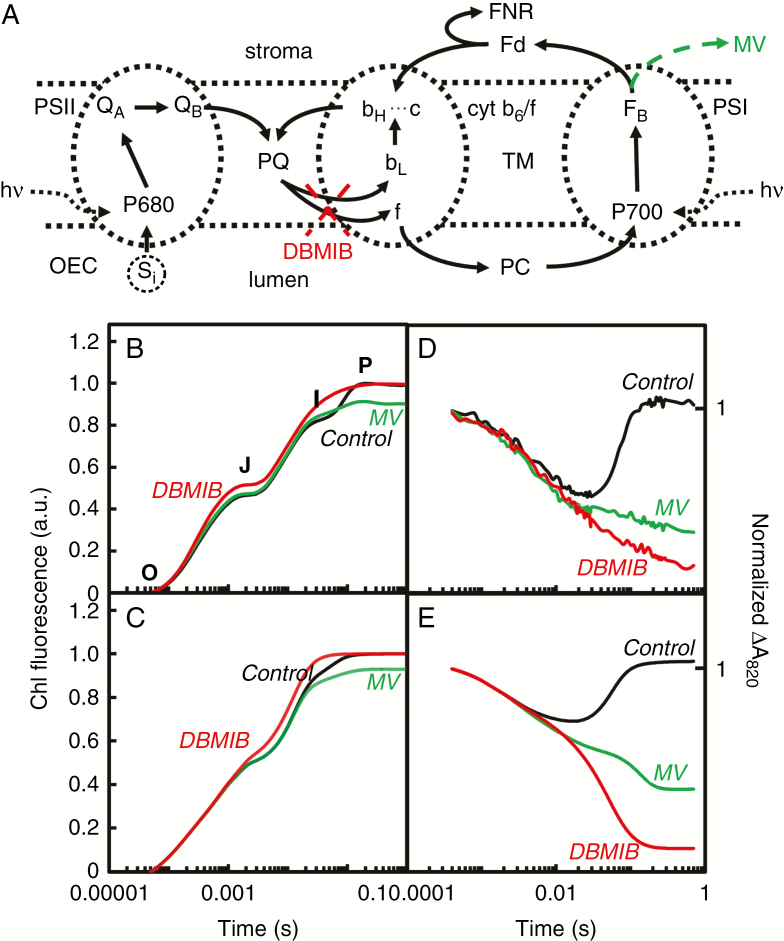
Fig. 8.
Diagram of the ET reactions used in the model of Lazár (2009) (A), the O-J-I-P ChlF transients measured on control (= untreated) leaves, as well as on leaves treated with 2,5-dibromo-3-methyl-6-isopropyl-p-benzoquinone (DBMIB, which inhibits ET in the cytochrome b6/f, see A) or with methyl-viologen (MV, which accepts electrons from the iron–sulfur cluster of PSI and ferredoxin, Fd, see A) (B), and the respective curves simulated with the model (C), the ΔA820 curves measured under the same conditions (D), and the respective curves simulated by the model (E). The curves are shown on a logarithmic time scale. Abbreviations: Si, the S-states of the oxygen-evolving complex (OEC); f, bL, bH…c, cytochrome f, low/potential cytochrome b6, and high-potential cytochrome b6 in kinetic equilibrium with the haem c of cytochrome b6/f complex; PC, plastocyanin. Modified from Lazár (2009).

