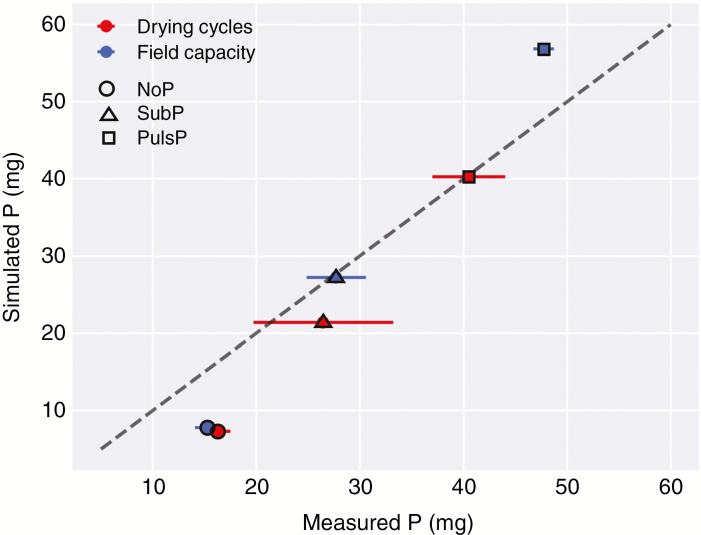
Fig. 2.
The simulated P uptake per plant (mg per plant or mg per pot, one plant per pot) vs. the measured P uptake per plant in the lab experiment (including the s.e.m.). The latter value of total P uptake was calculated for the shoot and the root after measuring shoot P concentration, and assuming an equal P concentration in the root. Rice root systems were grown and simulated on a P-deficient soil with three P treatments in the topsoil [no P amendment (NoP), a sub-optimal rate (SubP) and a non-limiting rate (PlusP)] and two water regimes [field capacity (FC) and drying periods (DP)].

