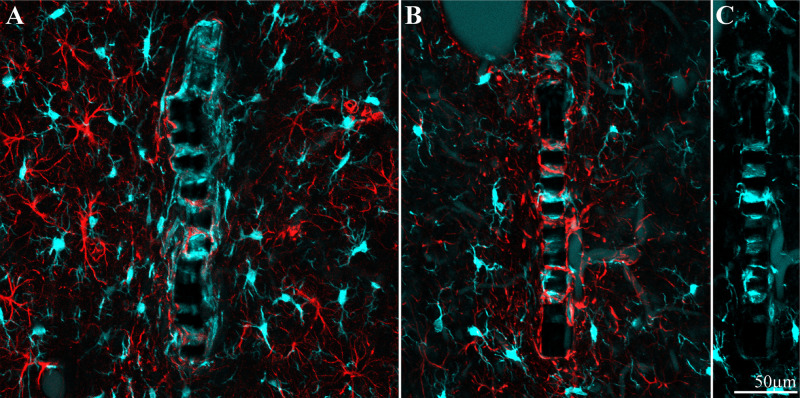
FIGURE 9.
Different distribution patterns of microglia and astrocytes around and within an implant. (A) Two weeks and (B), 8 weeks after implantation. In both images the platform surface is occupied by adhering cells in (A) mainly by microglia (cyan) and in (B) mainly by astrocytes (red). To reveal the presence of adhering microglia in (B), the Iba-1 fluorescent signal of the adhering microglia was stretched (C).

