Fig. 2.

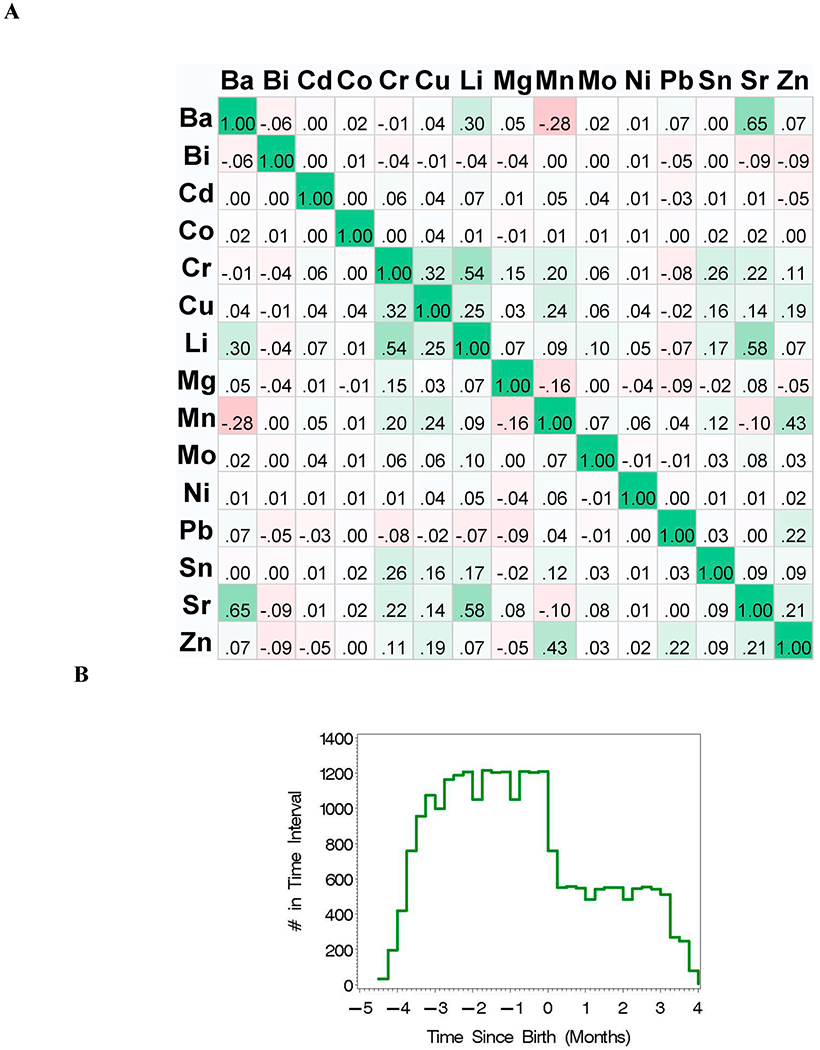
(A) Heat Map for Spearman correlation coefficients for all data (N = 162); and (B) histogram for the number of time points over time-since-birth (months).

(A) Heat Map for Spearman correlation coefficients for all data (N = 162); and (B) histogram for the number of time points over time-since-birth (months).