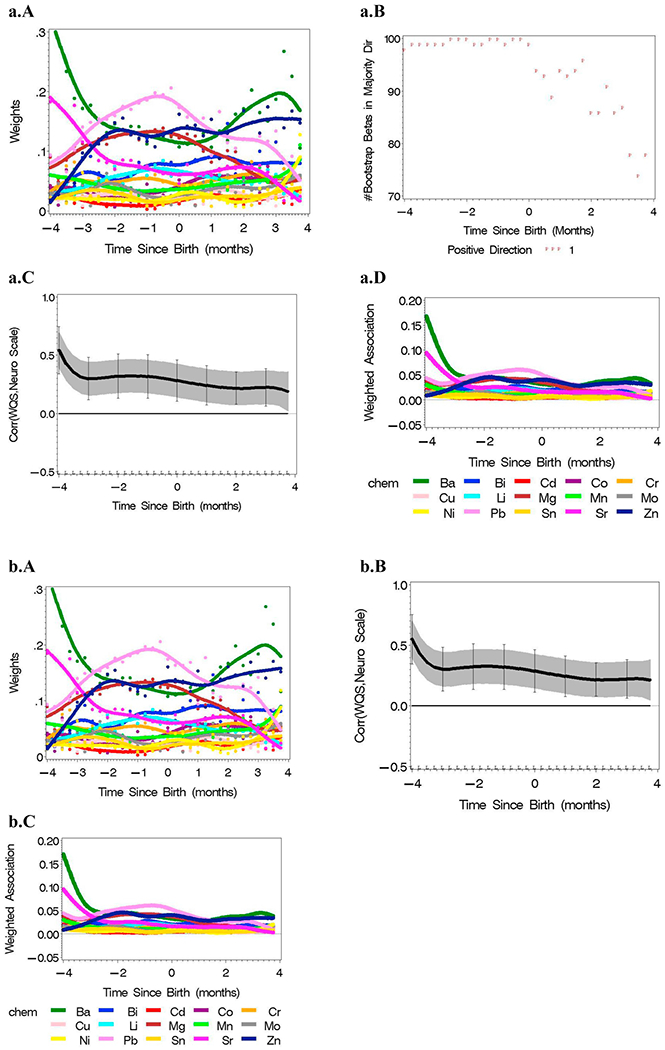
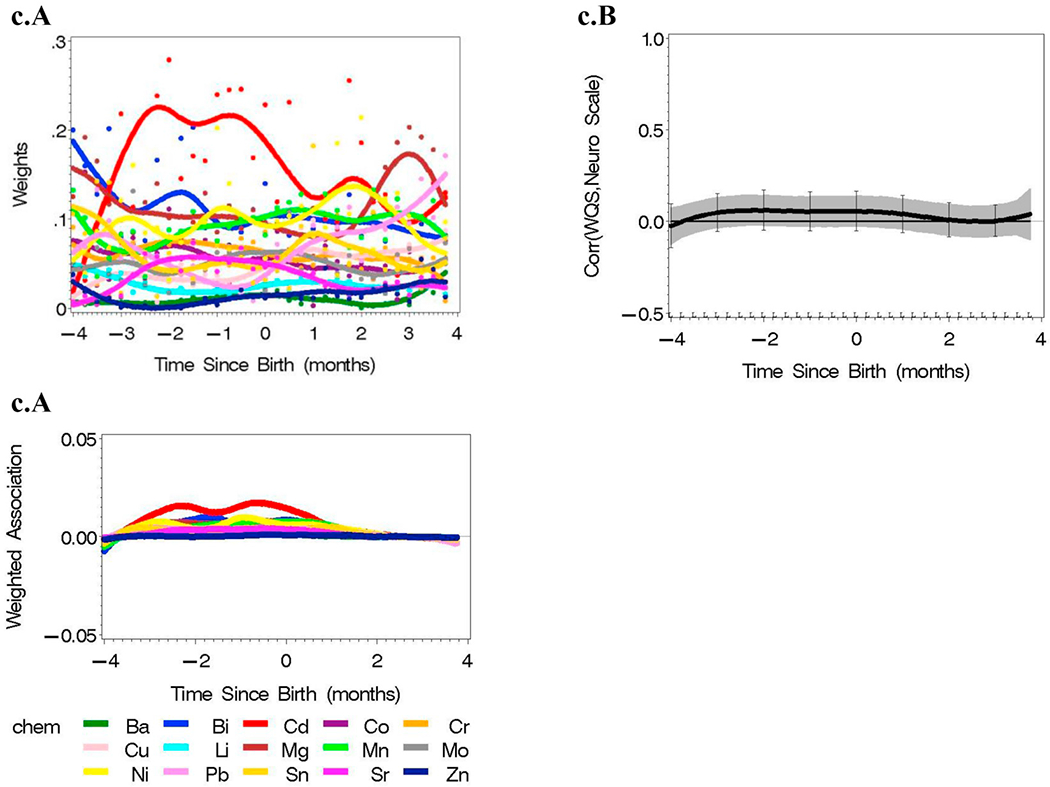
Fig. 4.


a Results from lagged WQS regression analysis of the mixture of 15 metals and a neuro scale unconstrained, adjusted by covariates in Table 1 (n = 162 with an average of 136 time points per subject). (A) WQS regression was conducted in quarter-month intervals with estimated weights and LOESS plot over analyses, and (B) the number of betas in the majority direction from the 100 bootstrap samples. (C) The resulting WQS(t) calculated in each quarter month analysis were used in a reverse DLM analysis with (D) related weighted association across the 15 metals plotted. b: Results from lagged WQS regression analysis of the mixture of 15 metals and a neuro scale constrained in the positive direction, adjusted by covariates in Table 1 (n = 162 with an average of 136 time points per subject). (A) WQS regression was conducted in quarter-month intervals with estimated weights and LOESS plot over analyses. (B) The resulting WQS(t) calculated in each quarter month analysis were used in a reverse DLM analysis with (C) related weighted association across the 15 metals plotted, c: Results from lagged WQS regression analysis of the mixture of 15 metals and a neuro scale constrained in the negative direction, adjusted by covariates in Table 1 (n = 162 with an average of 136 time points per subject). (A) WQS regression was conducted in quarter-month intervals with estimated weights and LOESS plot over analyses. (B) The resulting WQS (t) calculated in each quarter month analysis were used in a reverse DLM analysis with (C) related weighted association across the 15 metals plotted.
