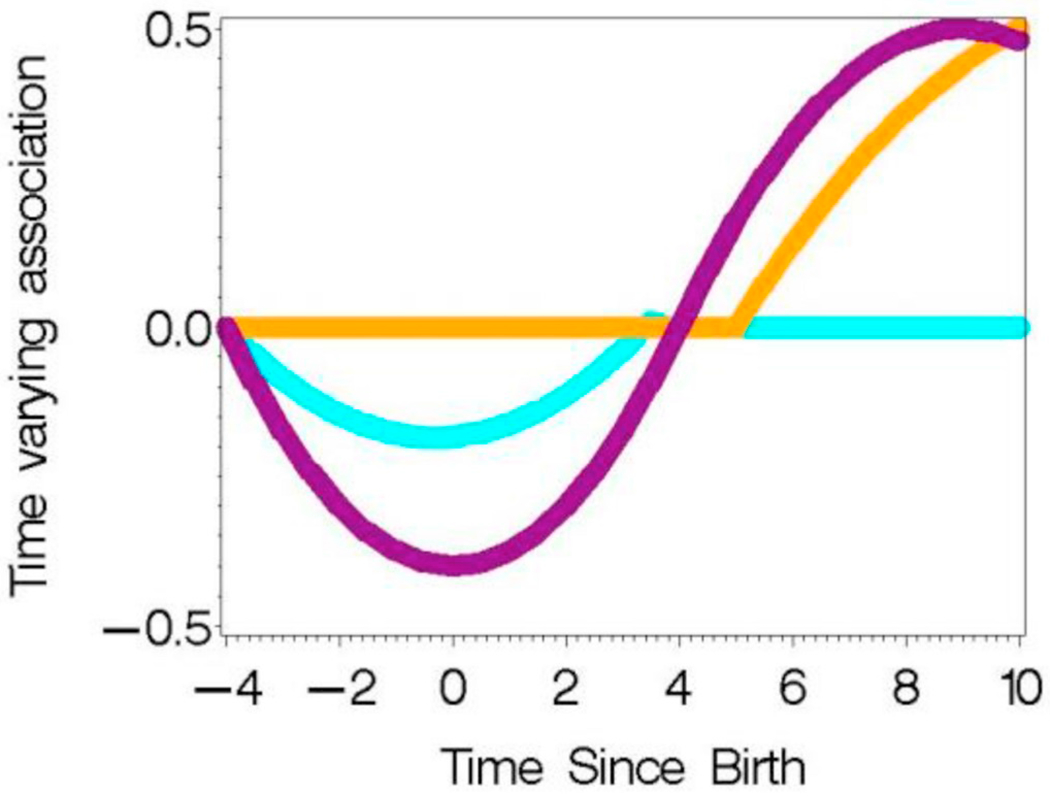
Fig. 5.

Assumed time varying association between Y and X4 (purple: Cases 1,2), X5 (orange: Case 2), and X7 (cyan: Case 2) in simulated data. (For interpretation of the references to color in this figure legend, the reader is referred to the Web version of this article.)
