
Table 4.
Multivariate linear regression of serum c-reactive protein vs. alcohol consumption measures.
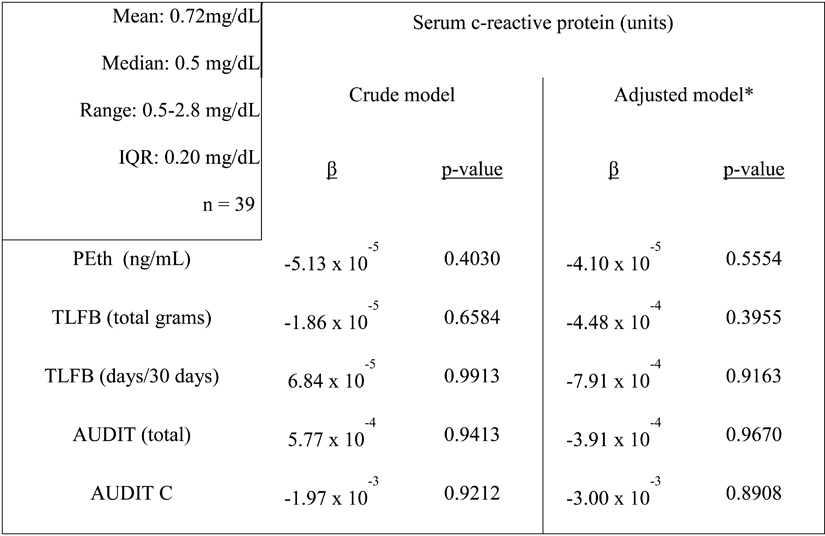 |
Descriptive statistics of serum c-reactive protein listed in left panel.
*
Model adjusted for age, gender, education, race, smoking status, viral load, CD4 count.