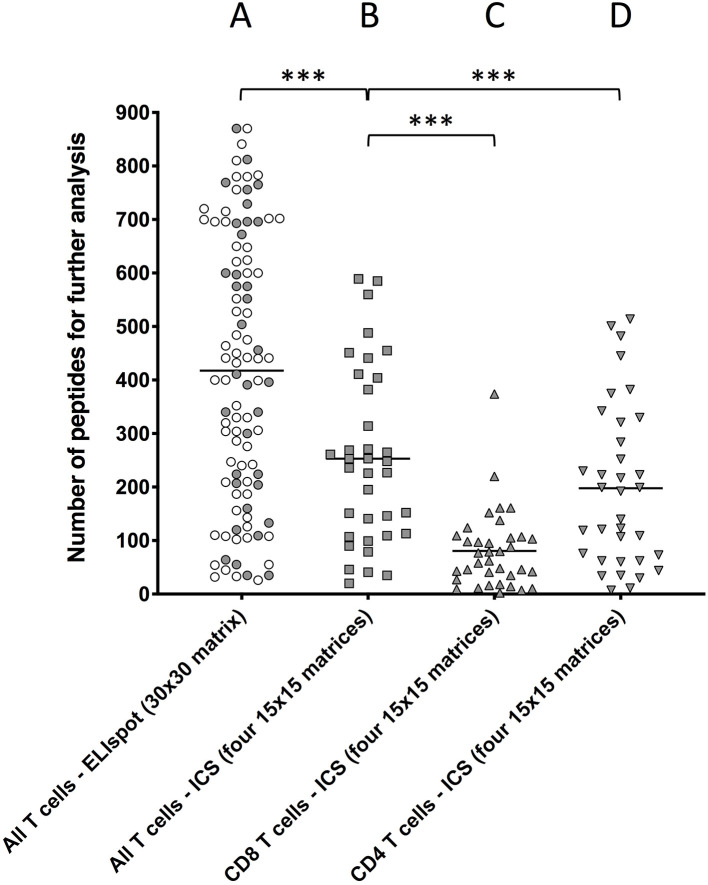
Figure 1.
Comparing the number of peptide-containing peptides identified by the two different approaches. T cells obtained ex vivo from primary YFV vaccinees were stimulated with matrix-derived pools of YFV peptides and responses were read by IFNγ-specific ELIspot or ICS. The peptides were distributed into matrixes, column and row pools of peptides were generated, and used to test T cell stimulation. Intersections of stimulatory column and row pools putatively identified single stimulatory peptides for further analysis (Supplementary Figure S3). (A) Peptides were distributed into one 30 ×30 matrix generating 30 + 30 = 60 pools, which were used to stimulate T cell responses in 94 donors using an IFNγ-specific ELISpot assay as readout of all (i.e., CD4+ and CD8+) T cell responses [average 418 positive intersections (range 26–870)]. (B,C) Peptides were distributed into four ca. 15 × 15 matrices generating 4x(ca. 15 + 15) ca. 120 pools, which were used to stimulate T cell responses in 36 donors using an IFNγ-specific ICS assay as readout of (B) all T cell responses [average 253 intersections (range 20–589)], (C) CD8+ T cell responses [average 80 intersections (range 2–374), and (D] CD4+ T cell responses average 197 intersections (range 7–514). The symbols representing the 36 donors that were examined by both ELISpot and ICS have been shaded. Mann Whitney U test was used to determine the significance of the difference between the indicated groups (***p < 0.0001).

