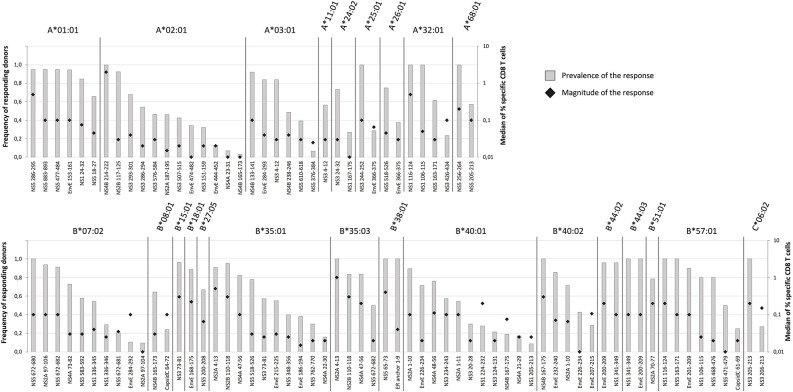
Figure 4.
Prevalence and magnitude of CD8+ T cell responses. To determine the prevalence and the median magnitude of the CD8+ T cell responses toward the epitopes discovered by the HFRI approach in 50 donors were extended to additional donors expressing the relevant HLA-I restriction elements. Only donors sampled 12–21 days after vaccination were included. The prevalence (gray columns) and the median magnitude of the responses (black diamond) were determined for each epitope-HLA combination. Only epitope-HLA combinations analyzed in 5 or more donors were included. The epitopes are organized according to restriction elements. The top figure shows the HLA-A restriction elements; the bottom figure shows the HLA-B and -C restriction elements.

