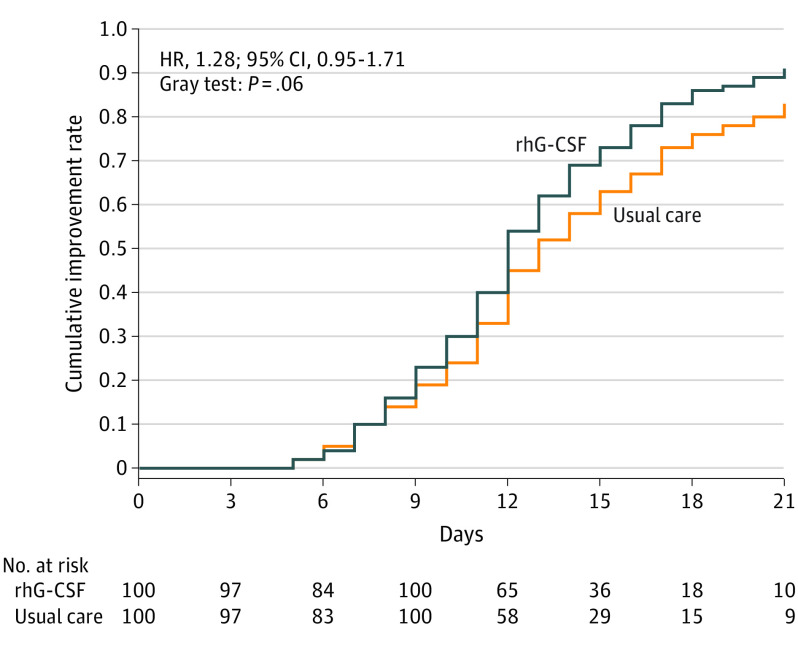
Figure 2. Time to Clinical Improvement at Day 21.
The blue curve indicates the recombinant human granulocyte colony-stimulating factor (rhG-CSF) group, whereas the orange curve denotes the control group (usual care). The hazard ratio (HR) of achieving clinical improvement, along with the 95% CI and the P value, is also reported. The hazards ratio with the 95% CI was estimated by using the Fine and Gray proportional subdistribution hazards model with treatment group, center, and oxygen therapy being included in the model.

