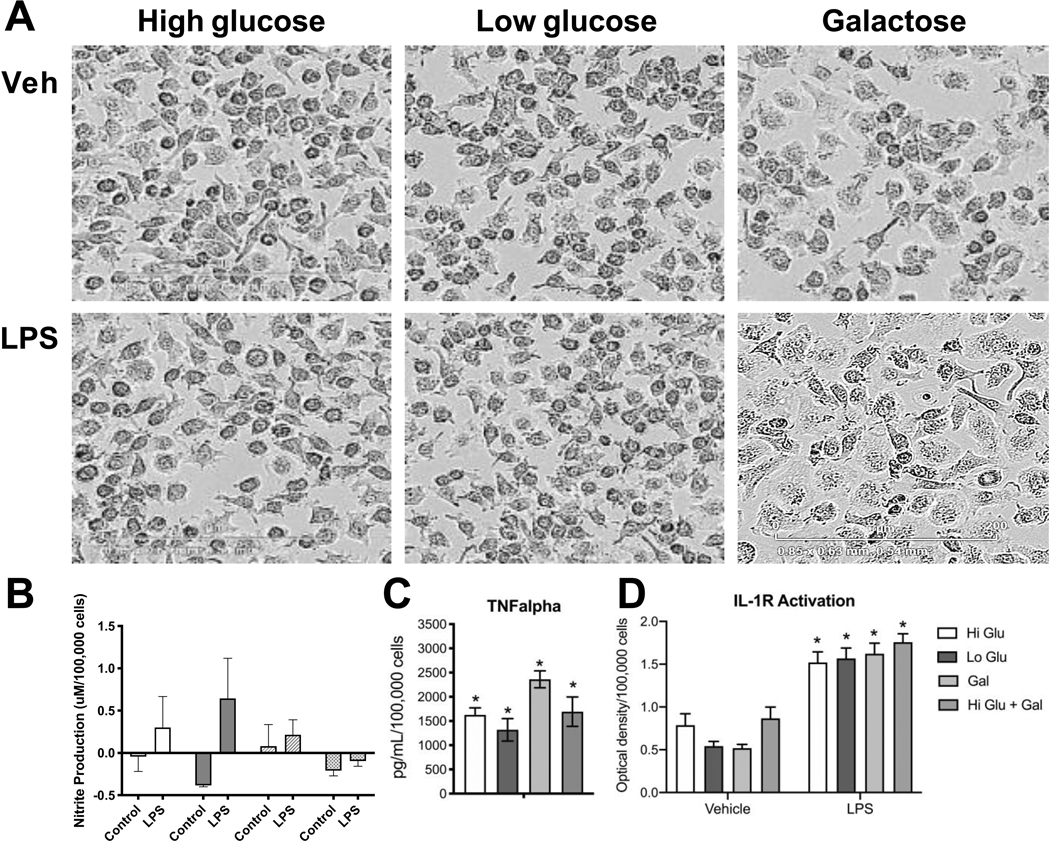
Figure 2.
Response of BV-2 cells to LPS under glucose or galactose medium conditions.
BV-2 murine microglia cells were plated in 6-well tissue culture plates (Corning, Corning, NY) and maintained in normal growth medium (DMEM (Gibco, ThermoFisher, Waltham, MA) containing 4.5 g/L glucose, 2mM L-glutamine, supplemented with 100 U/mL penicillin/streptomycin (Sigma-Aldrich, Burlington, MA) and 10% fetal bovine serum (FBS #100–106, 0.25 endotoxin units/mL; Gemini Bio-Products, Sacramento, CA) and allowed to reach 85% confluence over 3–5 days. Cells were maintained at 37°C, 5% CO2/5% O2, 90% humidity (Nu-5831 tri gas incubator, Nuaire, Plymouth, MN). The normal growth medium was changed to phenol-free medium containing: 1) high glucose (25mM), 2) low glucose (10mM), 3) galactose (10mM), or 4) high glucose + galactose). Cells were maintained in the experimental medium for 3 days following which, under the same media conditions, cells were exposed to lipopolysaccharide (LPS; 100ng/mL; Sigma) (A) monitored using a live cell imaging system (IncuCyte) under normal incubator conditions for up to 18 h. (B) Nitrite accumulation in culture medium was measured as an indirect indicator of nitric oxide synthesis using a Greiss Reagent kit (Promega, Madison, WI) following manufacturer’s instructions. Estimates were determined relative to standard curve. (C) Estimates of the release of IL-1 into the medium were obtained using HEX Blue™ IL-1R cells (InvivoGen, San Diego, CA) following manufacturer’s instructions. From 20μl aliquot of the medium, after a 1.5 h incubation at 37°C, absorbance at 620nm was measured using a BioTeck Synergy 4 plate reader. Data were calculated relative to background control. (D) TNFα protein levels were determined by Mouse TNFα ELISA MAX kit (BioLegend, San Diego, CA) with BD OptEIA Reagent Set B according to manufacturer’ instructions. Absorbance was measured at 450nm with a 570nm background subtraction. Protein levels were determined based on standard curve and calculated relative to total cell number as determined using IncuCyte software. Data represent mean +/− SEM (n=5–6). Data were analyzed by 2-way ANOVA followed by Bonferroni post-hoc comparisons. * Significance level as compared to vehicle control set at p<0.05.

