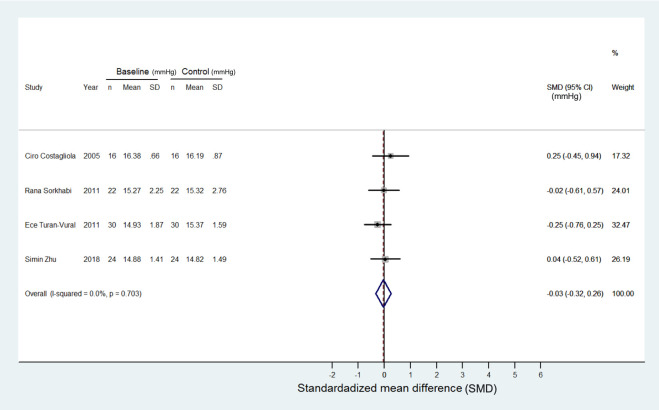
Fig 3. Forest plot depicting the meta-analysis for the SMD (standardized mean difference) in IOP in the glaucoma patients treated with PG monotherapy.
The data only involved four articles because the other three articles did not provide precise data for calculations. The patients in this forest plot is the control group when comparing with patients in Fig 2. The SMD cross zero without treatment preference. The control/baseline IOP was calculated in mmHg. The unit of SMD is in mmHg.

