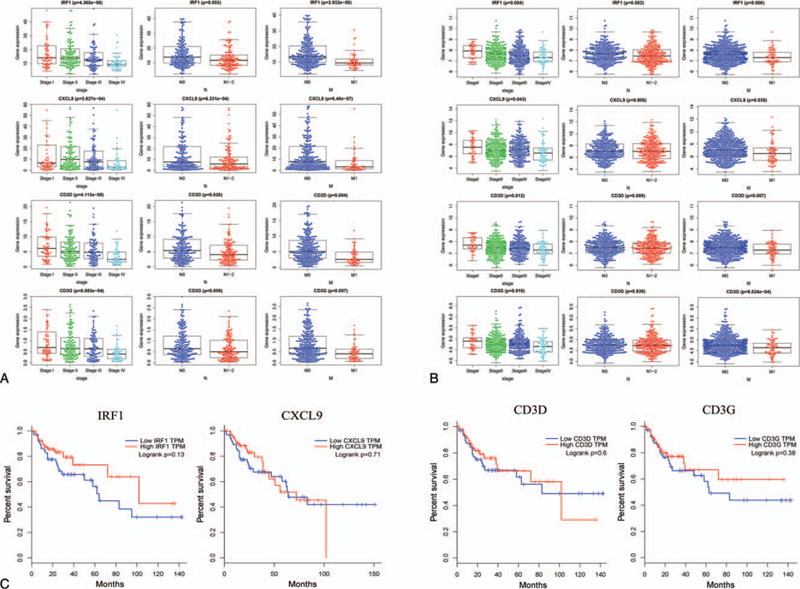
Figure 5.

Verification of the association between 4 DEGs and metastasis. (A) Boxplots of IRF1, CXCL9, CD3D, and CD3G expression in different groups according to tumor stage, lymphatic metastasis, and distant metastasis based on TCGA database. (B) Boxplots of IRF1, CXCL9, CD3D, and CD3G expression based on the GEO database. CD3D, CD3G, CXCL9, and IRF1 showed significant difference in the tumor stage and distant metastasis groups. IRF1 expression may be associated with lymph node metastasis (P = .052) (C) Kaplan–Meier survival curve of IRF1, CXCL9, CD3D, and CD3G based on the GEPIA. The group with high levels of IRF1 expression showed a longer overall survival than that with low IRF1 expression levels; however, there was no statistically significant difference found in the CXCL9, CD3D, and CD3G groups. CXCL9 = C-X-C motif chemokine ligand 9, DEG = differentially-expressed gene, GEO = Gene Expression Omnibus, IRF1 = interferon regulatory factor 1.
