Fig. 5.

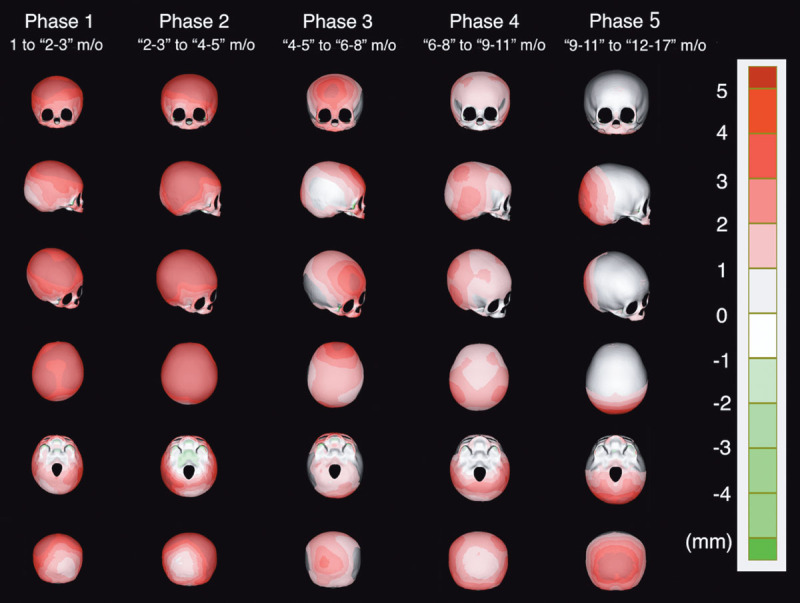
Heat map showing the shortest interplanar distance in the perpendicular direction between 2 average models of adjacent age groups. The larger the increase related to growth, the more reddish the color will be.

Heat map showing the shortest interplanar distance in the perpendicular direction between 2 average models of adjacent age groups. The larger the increase related to growth, the more reddish the color will be.