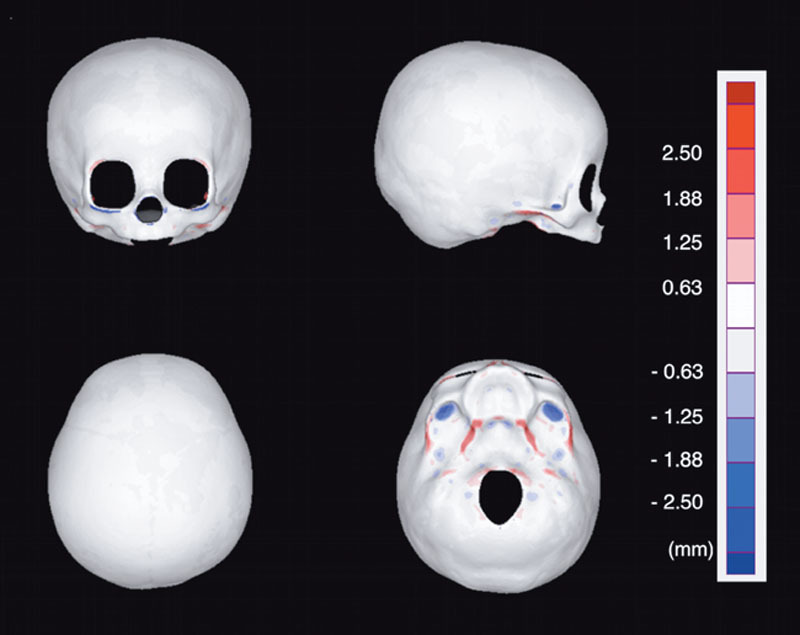
Fig. 6.

Heat map representing the deviation between the homologous model and the original voxel data. Deviation <0.625 mm (thickness of single CT slice) is shown with white. The average of deviation was the largest in the inferior view (0.390 mm). In the cranium, there was almost no deviation and the data of the homologous model matched well with the original CT data.
