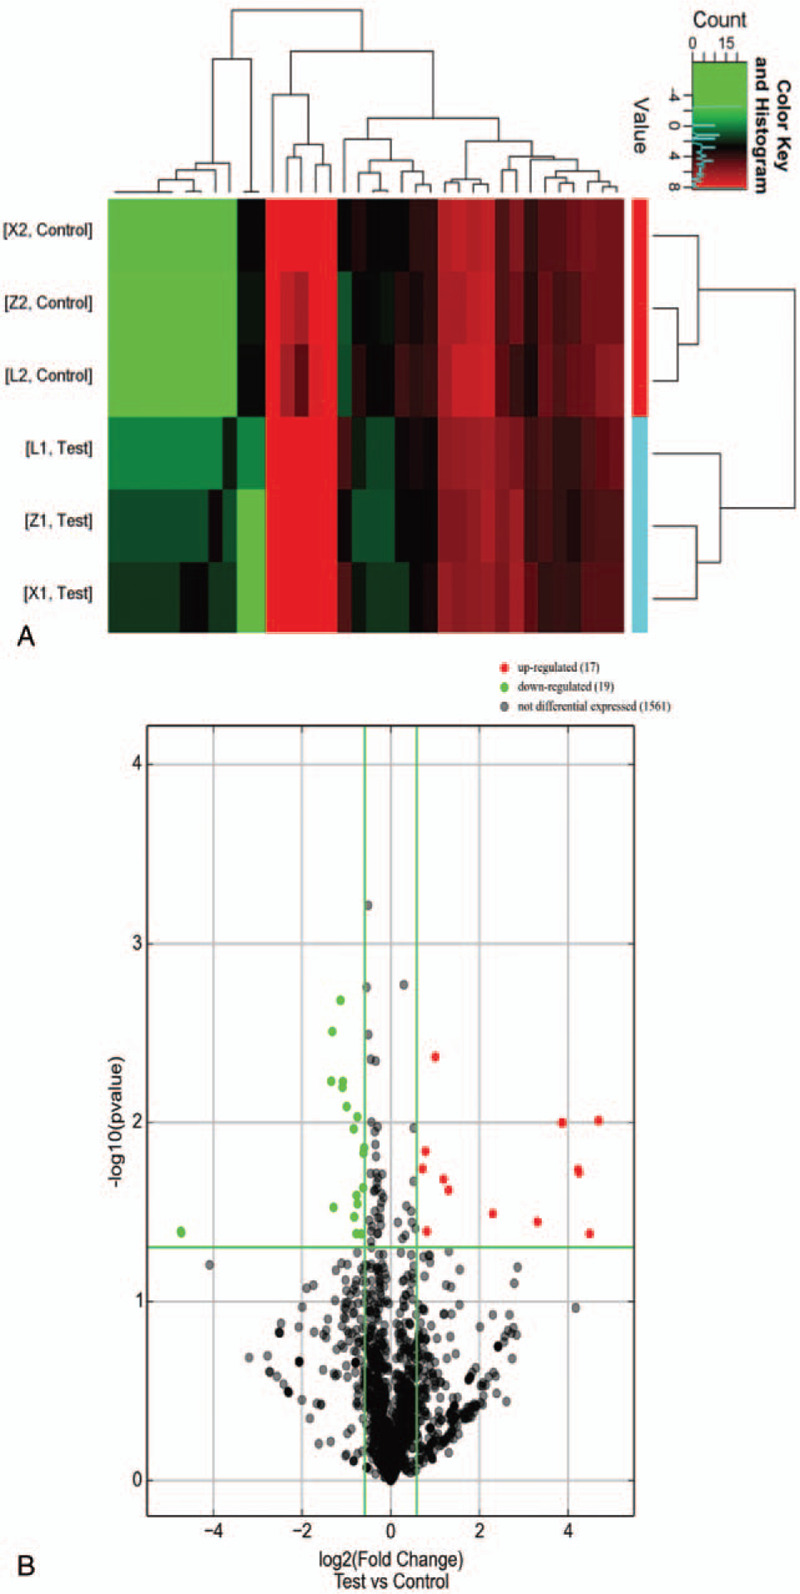
Figure 1.

Heatmap clustering (A) and volcanic plots (B) exhibiting the differentially expressed miRNAs in gastric cancer tissues, when compared to paired para-cancerous tissues. (A) X1, L1, and Z1 represent the gastric cancer tissues, and X2, L2, and Z2 represent the paired para-cancerous tissues. A total 36 differentially expressed miRNAs were shown. Among these, 17 miRNAs were upregulated, and 19 miRNAs were downregulated. (B) The red dots on the right side represent the upregulated expression, and the green dots on the left side represent the downregulated expression. The miRNAs of FC >1.5 outside the vertical green line. The miRNAs of P < .05 above the transverse green line.
