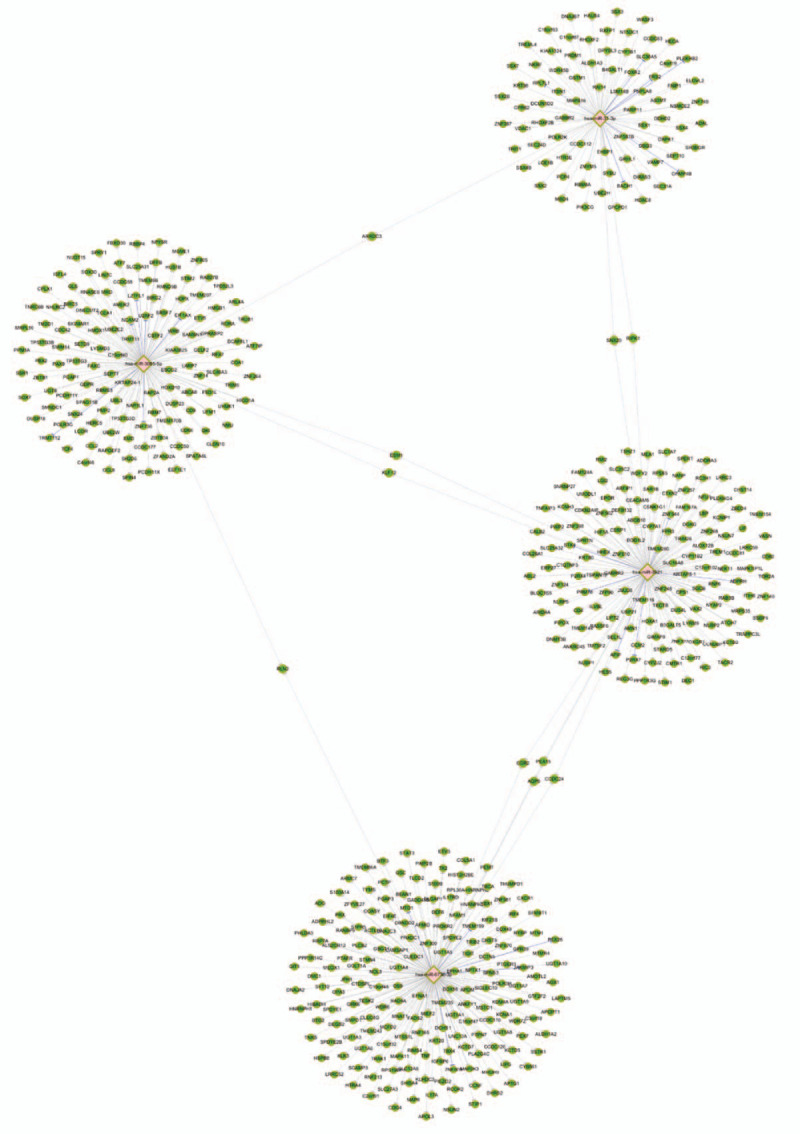
Figure 3.

The network map of miRNAs and mRNAs. The diamond nodes represent the miRNAs, and the green nodes represent the mRNAs. The gray lines represent the networks predicted by microTarBase 7.0, and the blue lines represent the networks verified in microTarBase 7.0. MiR-31-3p and miR-3065-5p had 1 shared target (ARRDC3), miR-31-3p and miR-3921 had 2 shared targets (SNX20 and RIPK1), miR-3921 and miR-3065-5p had 2 shared targets (ESM1 and KLF12), miR-6736-3p and miR-3921 had 4 shared targets (EGR2, PEA15, AQP5, and CCDC24), and miR-3065-5p and miR-6736-3p had 1 shared target (RLN2).
