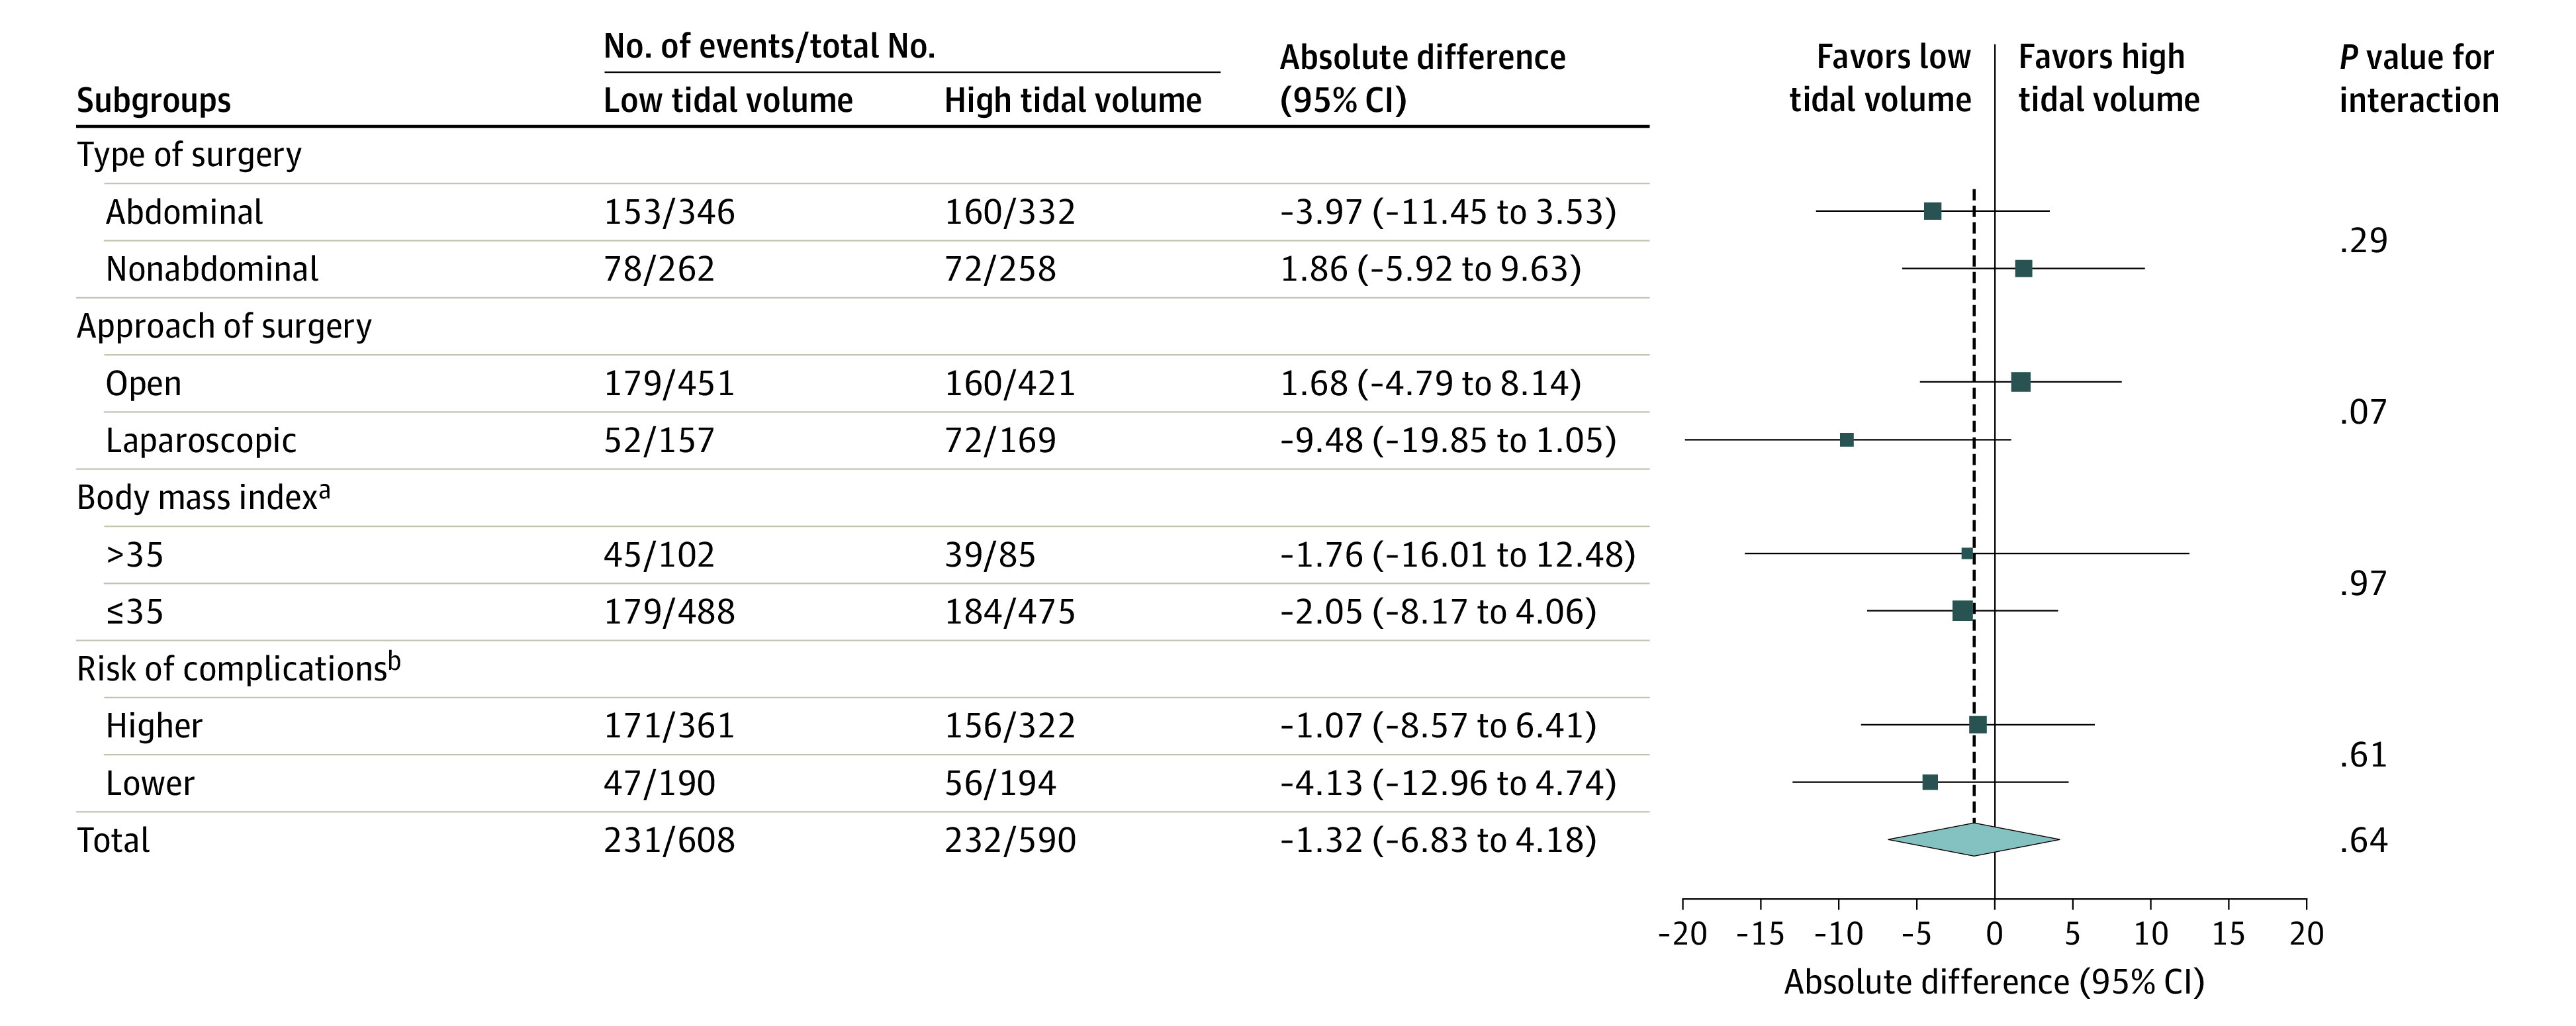
Figure 2. Absolute Differences of Postoperative Respiratory Complications in Prespecified Subgroups.

Sizes of data markers are proportional to the numbers of patients entering the analysis. P values are for the interaction between the subgroup and the treatment group. Lack of a significant interaction implies that the results are consistent across subgroups and that the overall effects estimated are the most appropriate estimates of treatment effect within each subgroup.
aCalculated as weight in kilograms divided by height in meters squared.
bRisk of complications is defined according to the Assess Respiratory Risk in Surgical Patients in Catalonia score as higher (≥26) or lower (<26).
