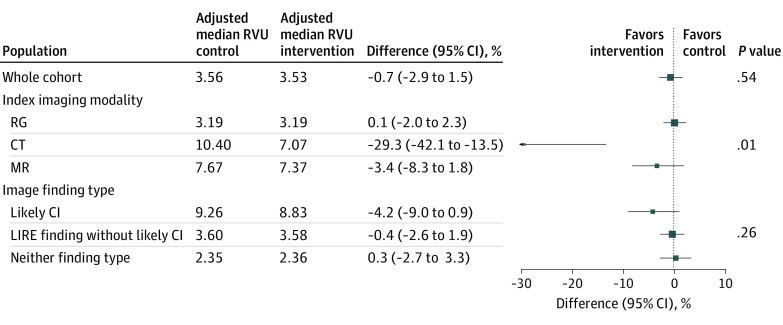
Figure 2. Model Results for Spine-Related Relative Value Units (RVUs) at 1 Year.
All models adjust for health system, clinic size, age range (ie, 18-39, 40-60, and ≥61 years), sex, imaging modality, Charlson Comorbidity Index category (ie, 0, 1, 2, and ≥3), and health system specific time trends. Models include hierarchical random effects for clinic (intercept and treatment) and primary care professional (intercept only). P values for subgroup models (ie, index imaging type and image finding type) are for Wald tests for effect modification. CI indicates clinically important, CT, computed tomography; RG, radiograph; and MR, magnetic resonance.

