
Figure 1. Example Input Image, Prediction Map Derived From Scalp and Hair Loss Identifiers, and Results.
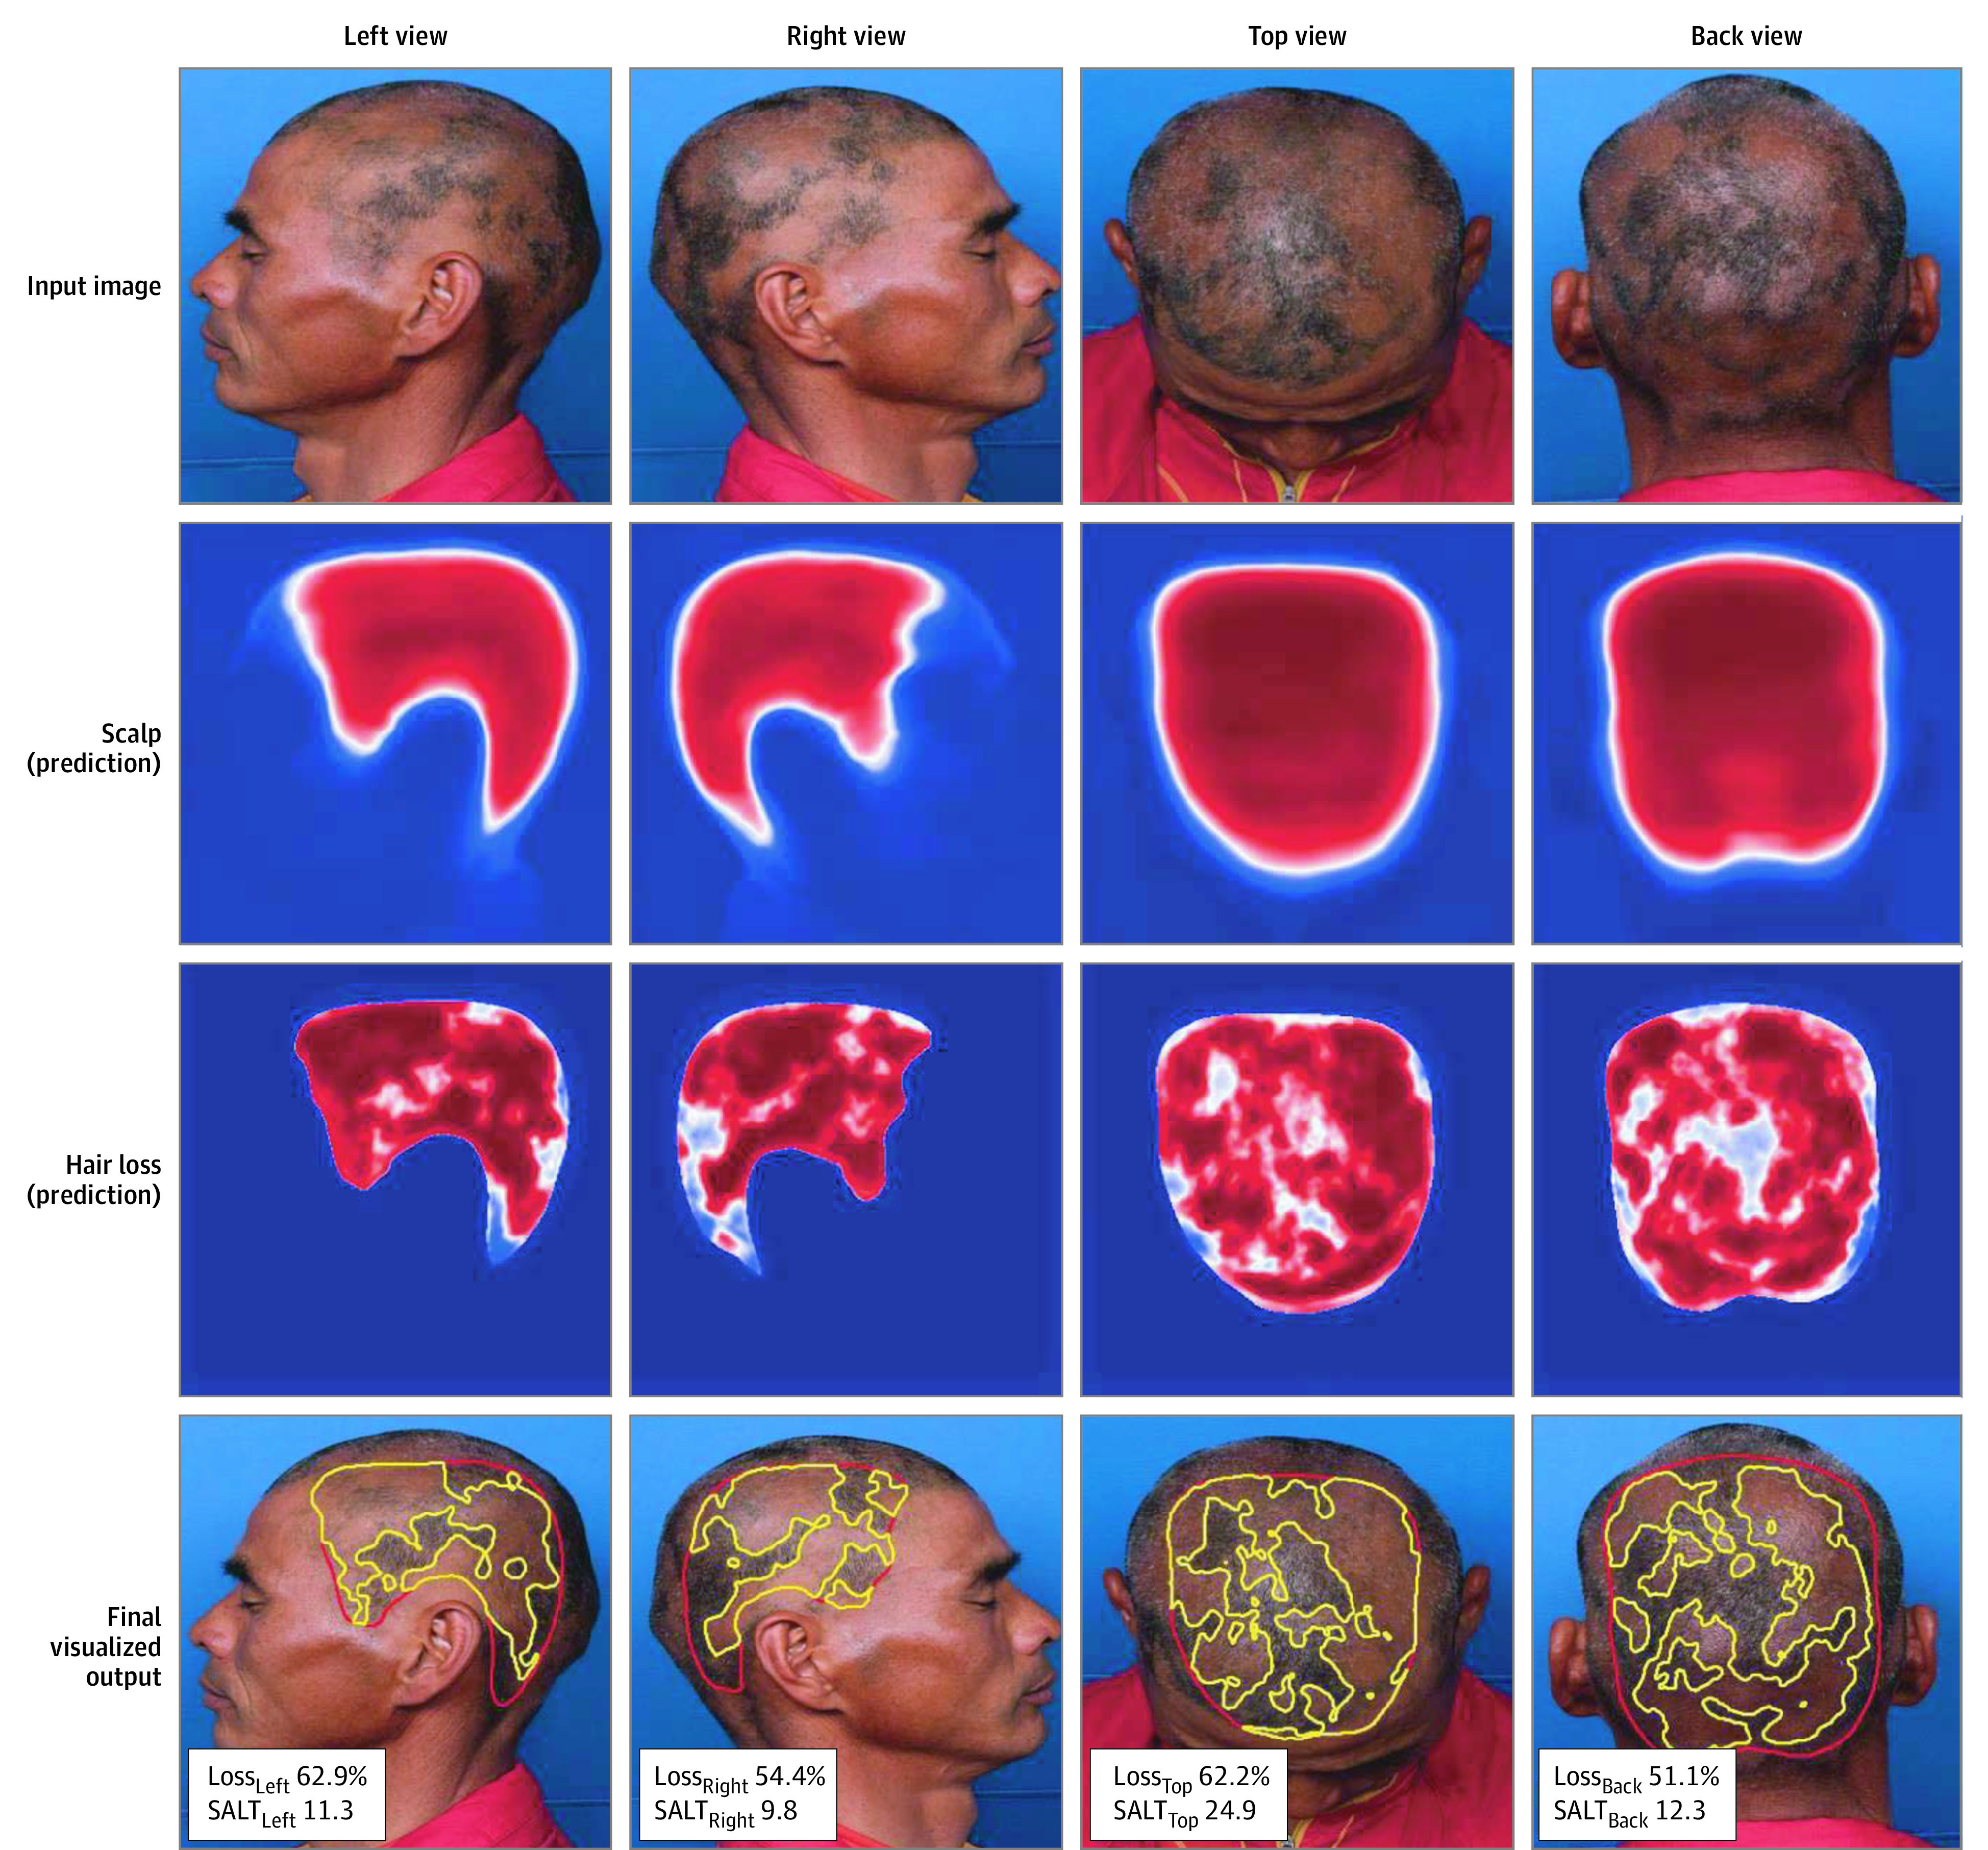
The scalp identifier first yields a prediction map for the scalp area based on the patient’s 4-view standardized photographs (left, right, top, and back views). The hair loss identifier yields a prediction map for the hair loss area by analyzing the masked image, created by synthesizing the input image and scalp prediction. The web application yields the final results along with a calculation of the percentage of hair loss and Severity of Alopecia Tool (SALT) score for each image. A function to adjust each threshold for optimizing the result was incorporated (eFigure 2 in the Supplement).