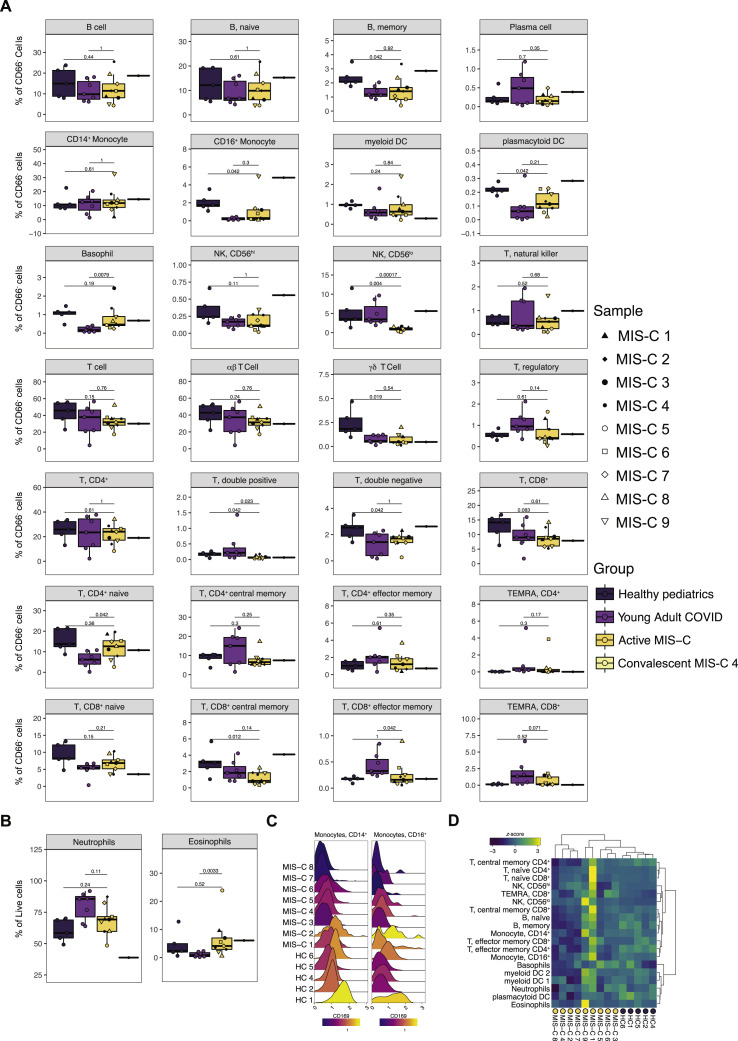
Figure S4.
Mass Cytometry of Peripheral Blood Immune Cells, Related to Figure 3
(A) Immune cell frequencies of all immunophenotypes cell types from age-matched healthy controls (n=5), acute COVID-19 infection in young adults (n=7), active MIS-C patients (n=9) and one convalescent MIS-C patient (MIS-C 4; represented as a single data point). (B). Granulocyte frequencies as a percentage of live cells. (C). Expression of CD169, an interferon-stimulated gene, in monocytes in pediatric healthy controls (N=4) and MIS-C patients (N=8; data unavailable for MIS-C 9). (E) Relative STAT1 phosphorylation.

