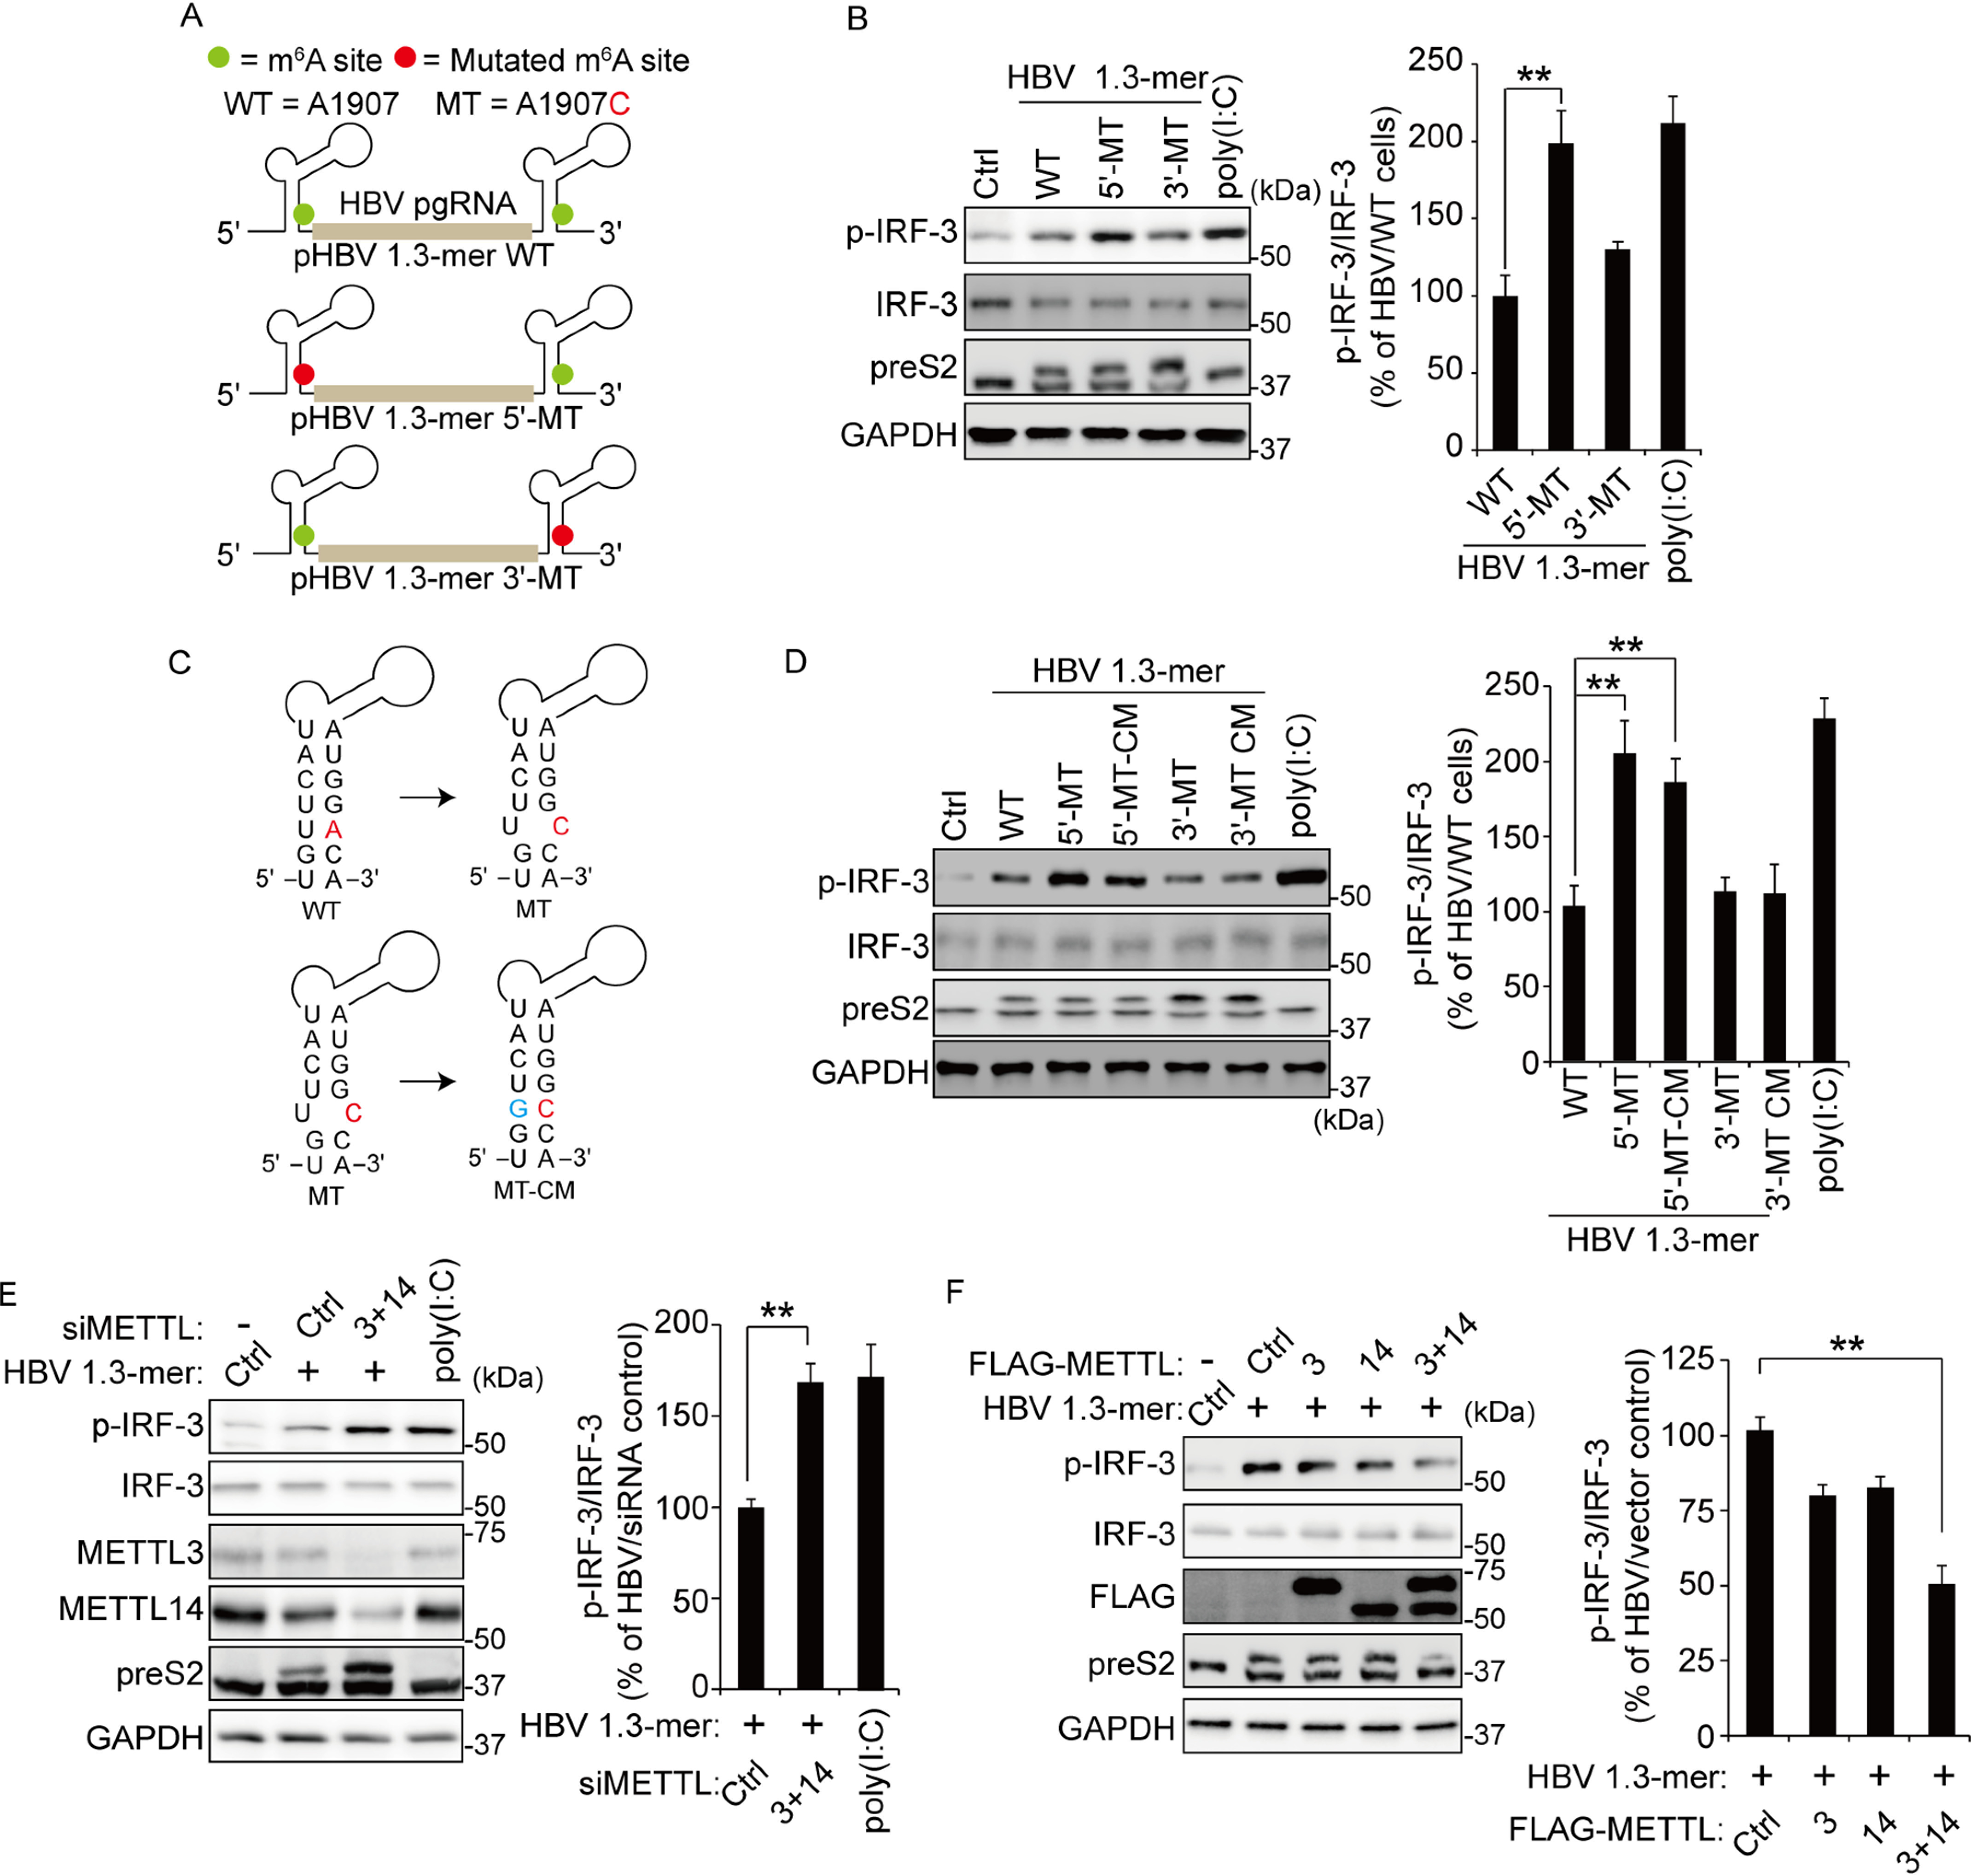
Figure 1.

The m6A modification of HBV pgRNA affects activation of IRF-3. A, schematics represent the location of the A1907C mutations of 5′ and 3′ m6A sites in HBV pgRNA. Green circles indicate the m6A site in HBV pgRNA. The pHBV 1.3-mer 5′-MT having the A1907C mutation at the 5′ end and pHBV 1.3-mer 3′-MT at the 3′ end. B, HepG2 cells were transfected with each indicated HBV plasmid. After 72 h, the cells were harvested to assess expression levels of p-IRF-3. Poly(I:C) was transfected in HepG2 cells before harvesting for 16 h. The right panel shows that p-IRF-3 protein levels relative to the IRF-3 from three independent experiments were quantified using ImageJ. C, the mutation of m6A site (red) in the ε structure is predicted to create a bubble. The compensatory U1851G mutation (green) was established either at the 5′ end (pHBV-5′-MT–CM) or the 3′ end (pHBV-3′-MT–CM). D, the indicated plasmids were transfected in HepG2 cells for 72 h. The lysates were extracted from these cells to analyzed p-IRF-3 levels. The p-IRF-3 levels were normalized by IRF-3 using ImageJ (in the right panel). E, relative p-IRF-3 levels in HBV 1.3-mer transfected HepG2 cells 4 h after siMETTL3 + 14 or control siRNA transfection was assessed by immunoblotting. HepG2 cells were stimulated by poly(I:C) for 16 h. The p-IRF-3 levels relative to IRF-3 from three independent experiments were quantified using ImageJ. F, HepG2 cells treated with HBV 1.3-mer were transfected with control or FLAG-METTL3/14 plasmids. After 72 h, the indicated proteins were analyzed by immunoblotting. The levels of p-IRF-3 relative to the IRF-3 from three independent experiments were quantified using ImageJ (in the right panel). In B and D–F, the error bars are the standard deviations of three independent experiments, each involving triplicate assays. Statistical significance of the difference between groups was determined via an unpaired Student's t test. *, P < 0.05; **, P < 0.01; ***, P < 0.001. Ctrl, control.
