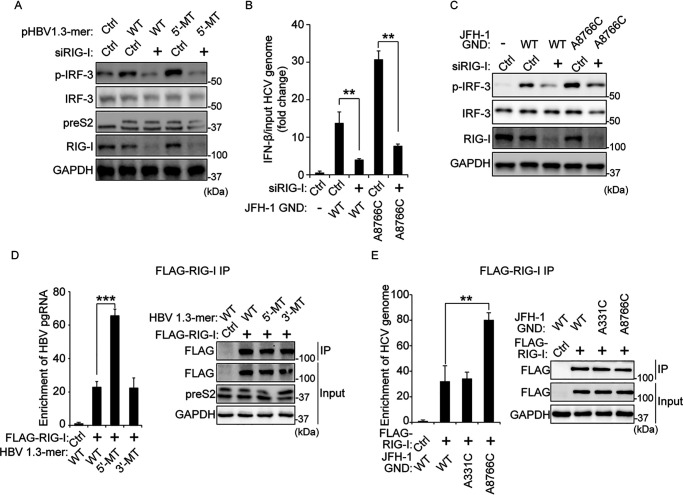
Figure 3.
The mutation on the m6A site of viral RNA increases interaction with RIG-I. A, HepG2 cells treated with siRNA of RIG-I or control siRNA were transfected with pHBV 1.3-mer or pHBV 1.3-mer 5′-MT. The p-IRF-3 levels were assessed by immunoblotting at 72 h post-pHBV 1.3-mer transfection. B and C, relative IFN-β mRNA (B) or p-IRF-3 (C) levels in HCV GND or A8766C transfected Huh7 cells 32 h after siRIG-I or control siRNA transfection were assessed by qRT-PCR or immunoblotting at 16 h post-HCV RNA transfection. Relative IFN-β mRNA levels were normalized by input HCV GND or A8766C RNA levels. The input HCV GND or A8766C RNA levels were analyzed by qRT-PCR, as shown in Fig. S4A. D, RNA immunoprecipitation from the indicated cells using anti-FLAG antibody, with qRT-PCR analysis of HBV pgRNA quantified as relative enrichment RNA levels (in the left panel). The enrichment RNA levels were normalized by input HBV pgRNA levels, as shown in Fig. S4B. Immunoblot analysis of FLAG–RIG-I in the input and IP is shown on the right panels. E, enrichment of HCV genome following immunoprecipitation of FLAG-tagged RIG-I from extracts of Huh7 cells 48 h after transfection. Enriched HCV genome was quantified by qRT-PCR as fold enrichment relative to control. The enrichment HCV RNA levels were normalized by input HCV RNA levels. The input HCV RNA levels are shown in Fig. S4C. FLAG-tagged RIG-I levels in input and IP were assessed by immunoblotting (in the right panel). In B, D, and E, the error bars are the standard deviations of three independent experiments. The P values were calculated using an unpaired t test. *, P < 0.05; **, P < 0.01; ***, P < 0.001. Ctrl, control; GAPDH, glyceraldehyde-3-phosphate dehydrogenase.

