Figure 1.

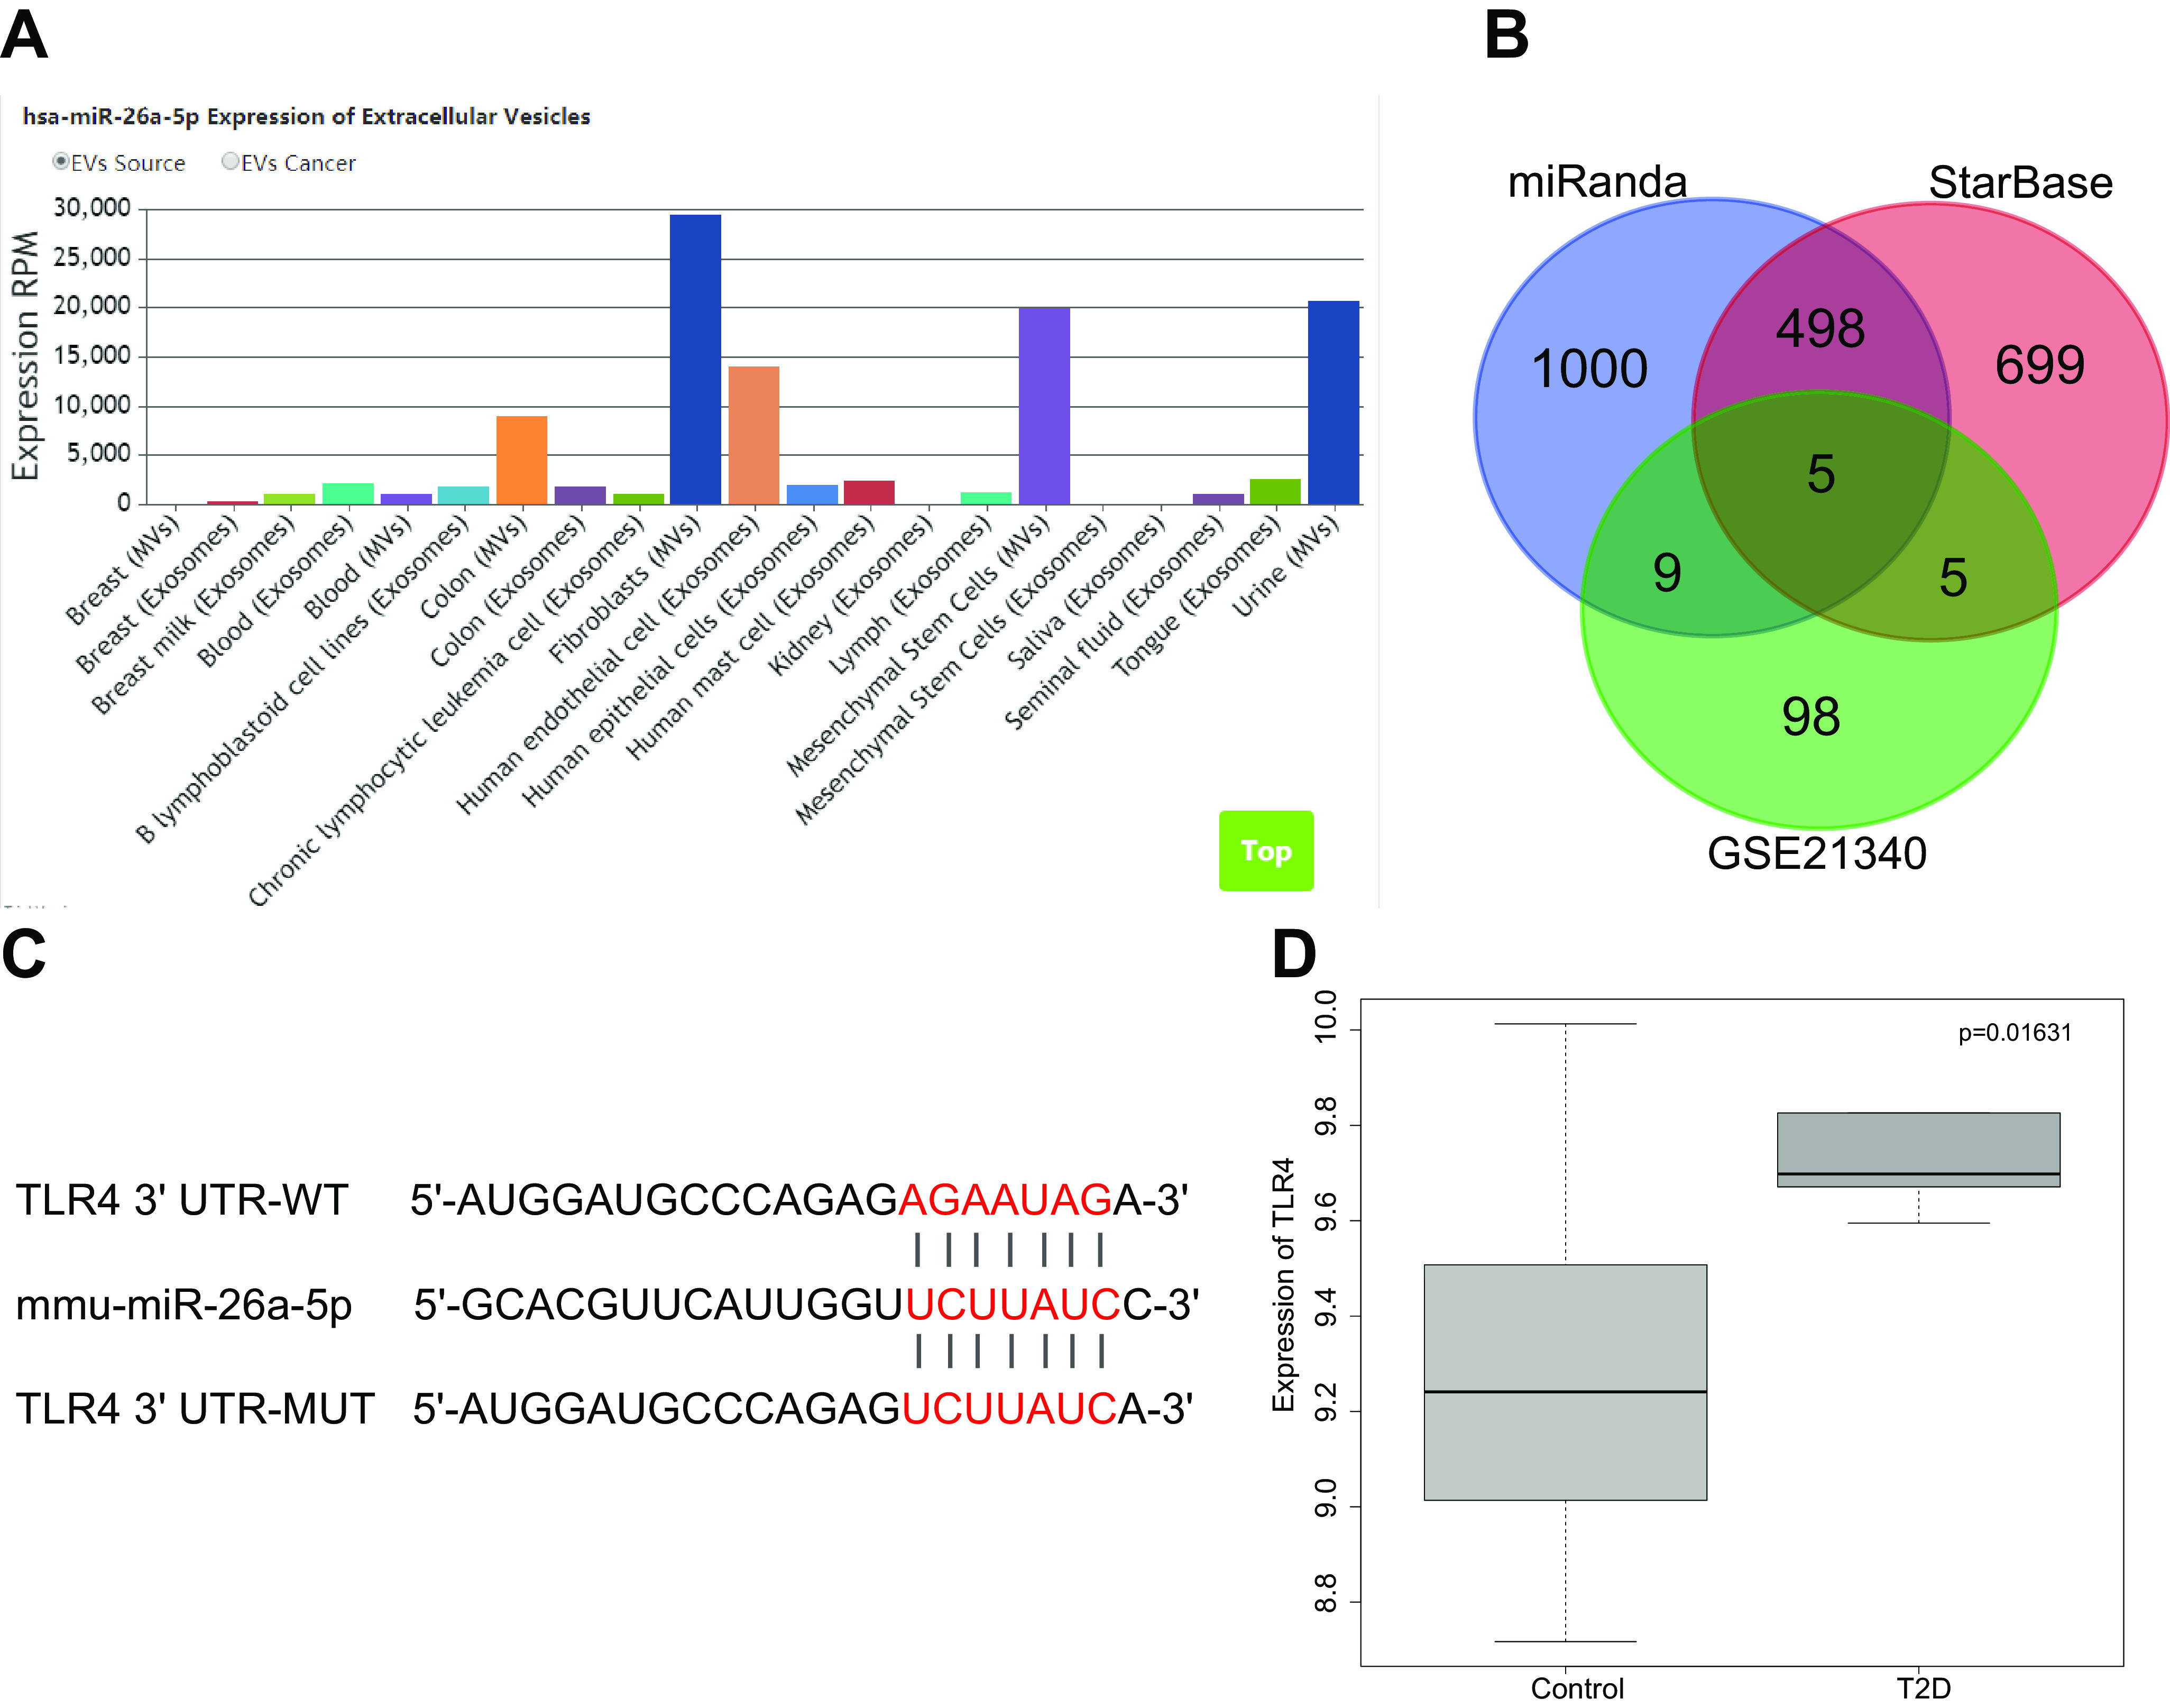
DN is characterized by poor miR-26a-5p expression and high TLR4 expression. A, the expression of miR-26a-5p in EVs. B, the intersection between predicted miR-26a-5p downstream target genes identified by the MiRanda and SatrBase databases and differentially expressed genes from the GSE21340 data set. The number represents the predicted number of target genes. C, a map of the predicted binding site of miR-26a-5p to TLR4 and mutant site. D, the box map for the differential expression of TLR4 gene in diabetes and normal samples. Paired t test was used to compare normal sample and diabetic samples.
