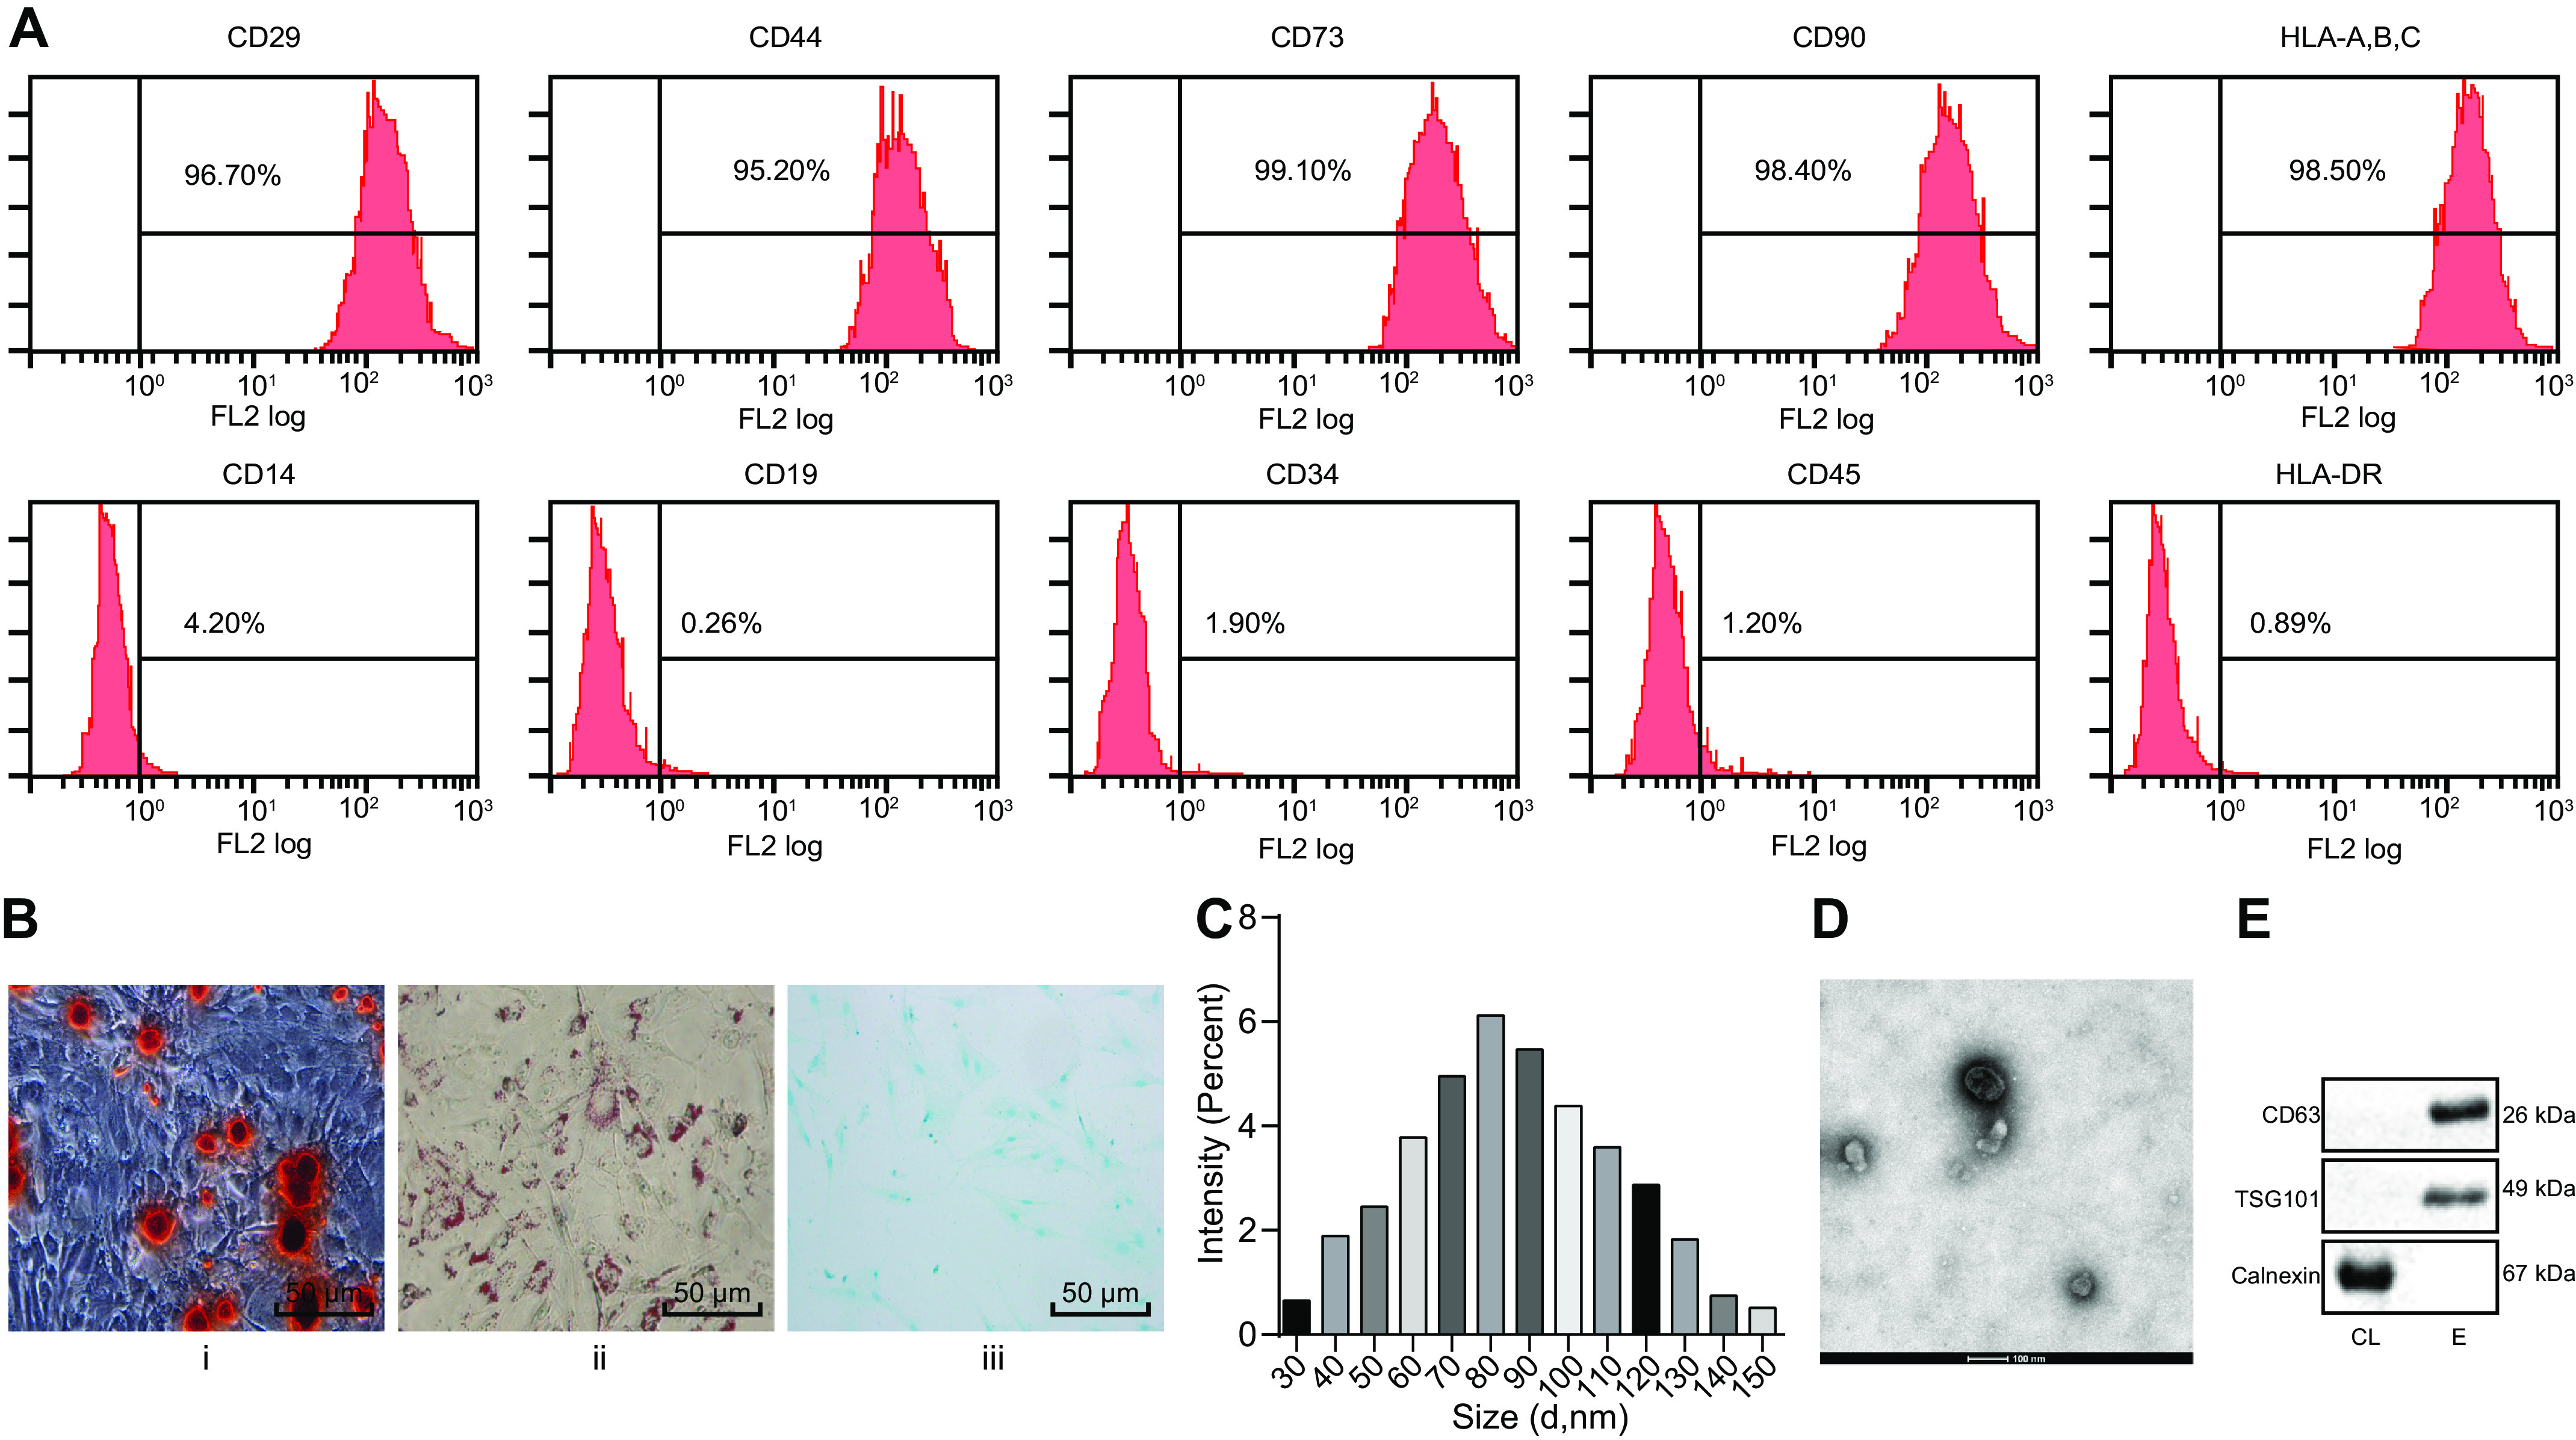
Figure 2.

EVs are successfully isolated from ADSCs. A, identification of ADSC surface markers by flow cytometry. B, i, detection of osteogenic differentiation by Alizarin Red S staining. ii, detection of lipogenic differentiation by oil red O staining. iii, detection of chondrogenic differentiation by Alcian blue staining (scale bar, 50 μm). C, size distribution of ADSC-derived EVs measured by DLS. D, observation of morphology of EVs by transmission EM (scale bar, 100 nm). E, CD63, TSG101, and calnexin detected by Western blotting analysis.
