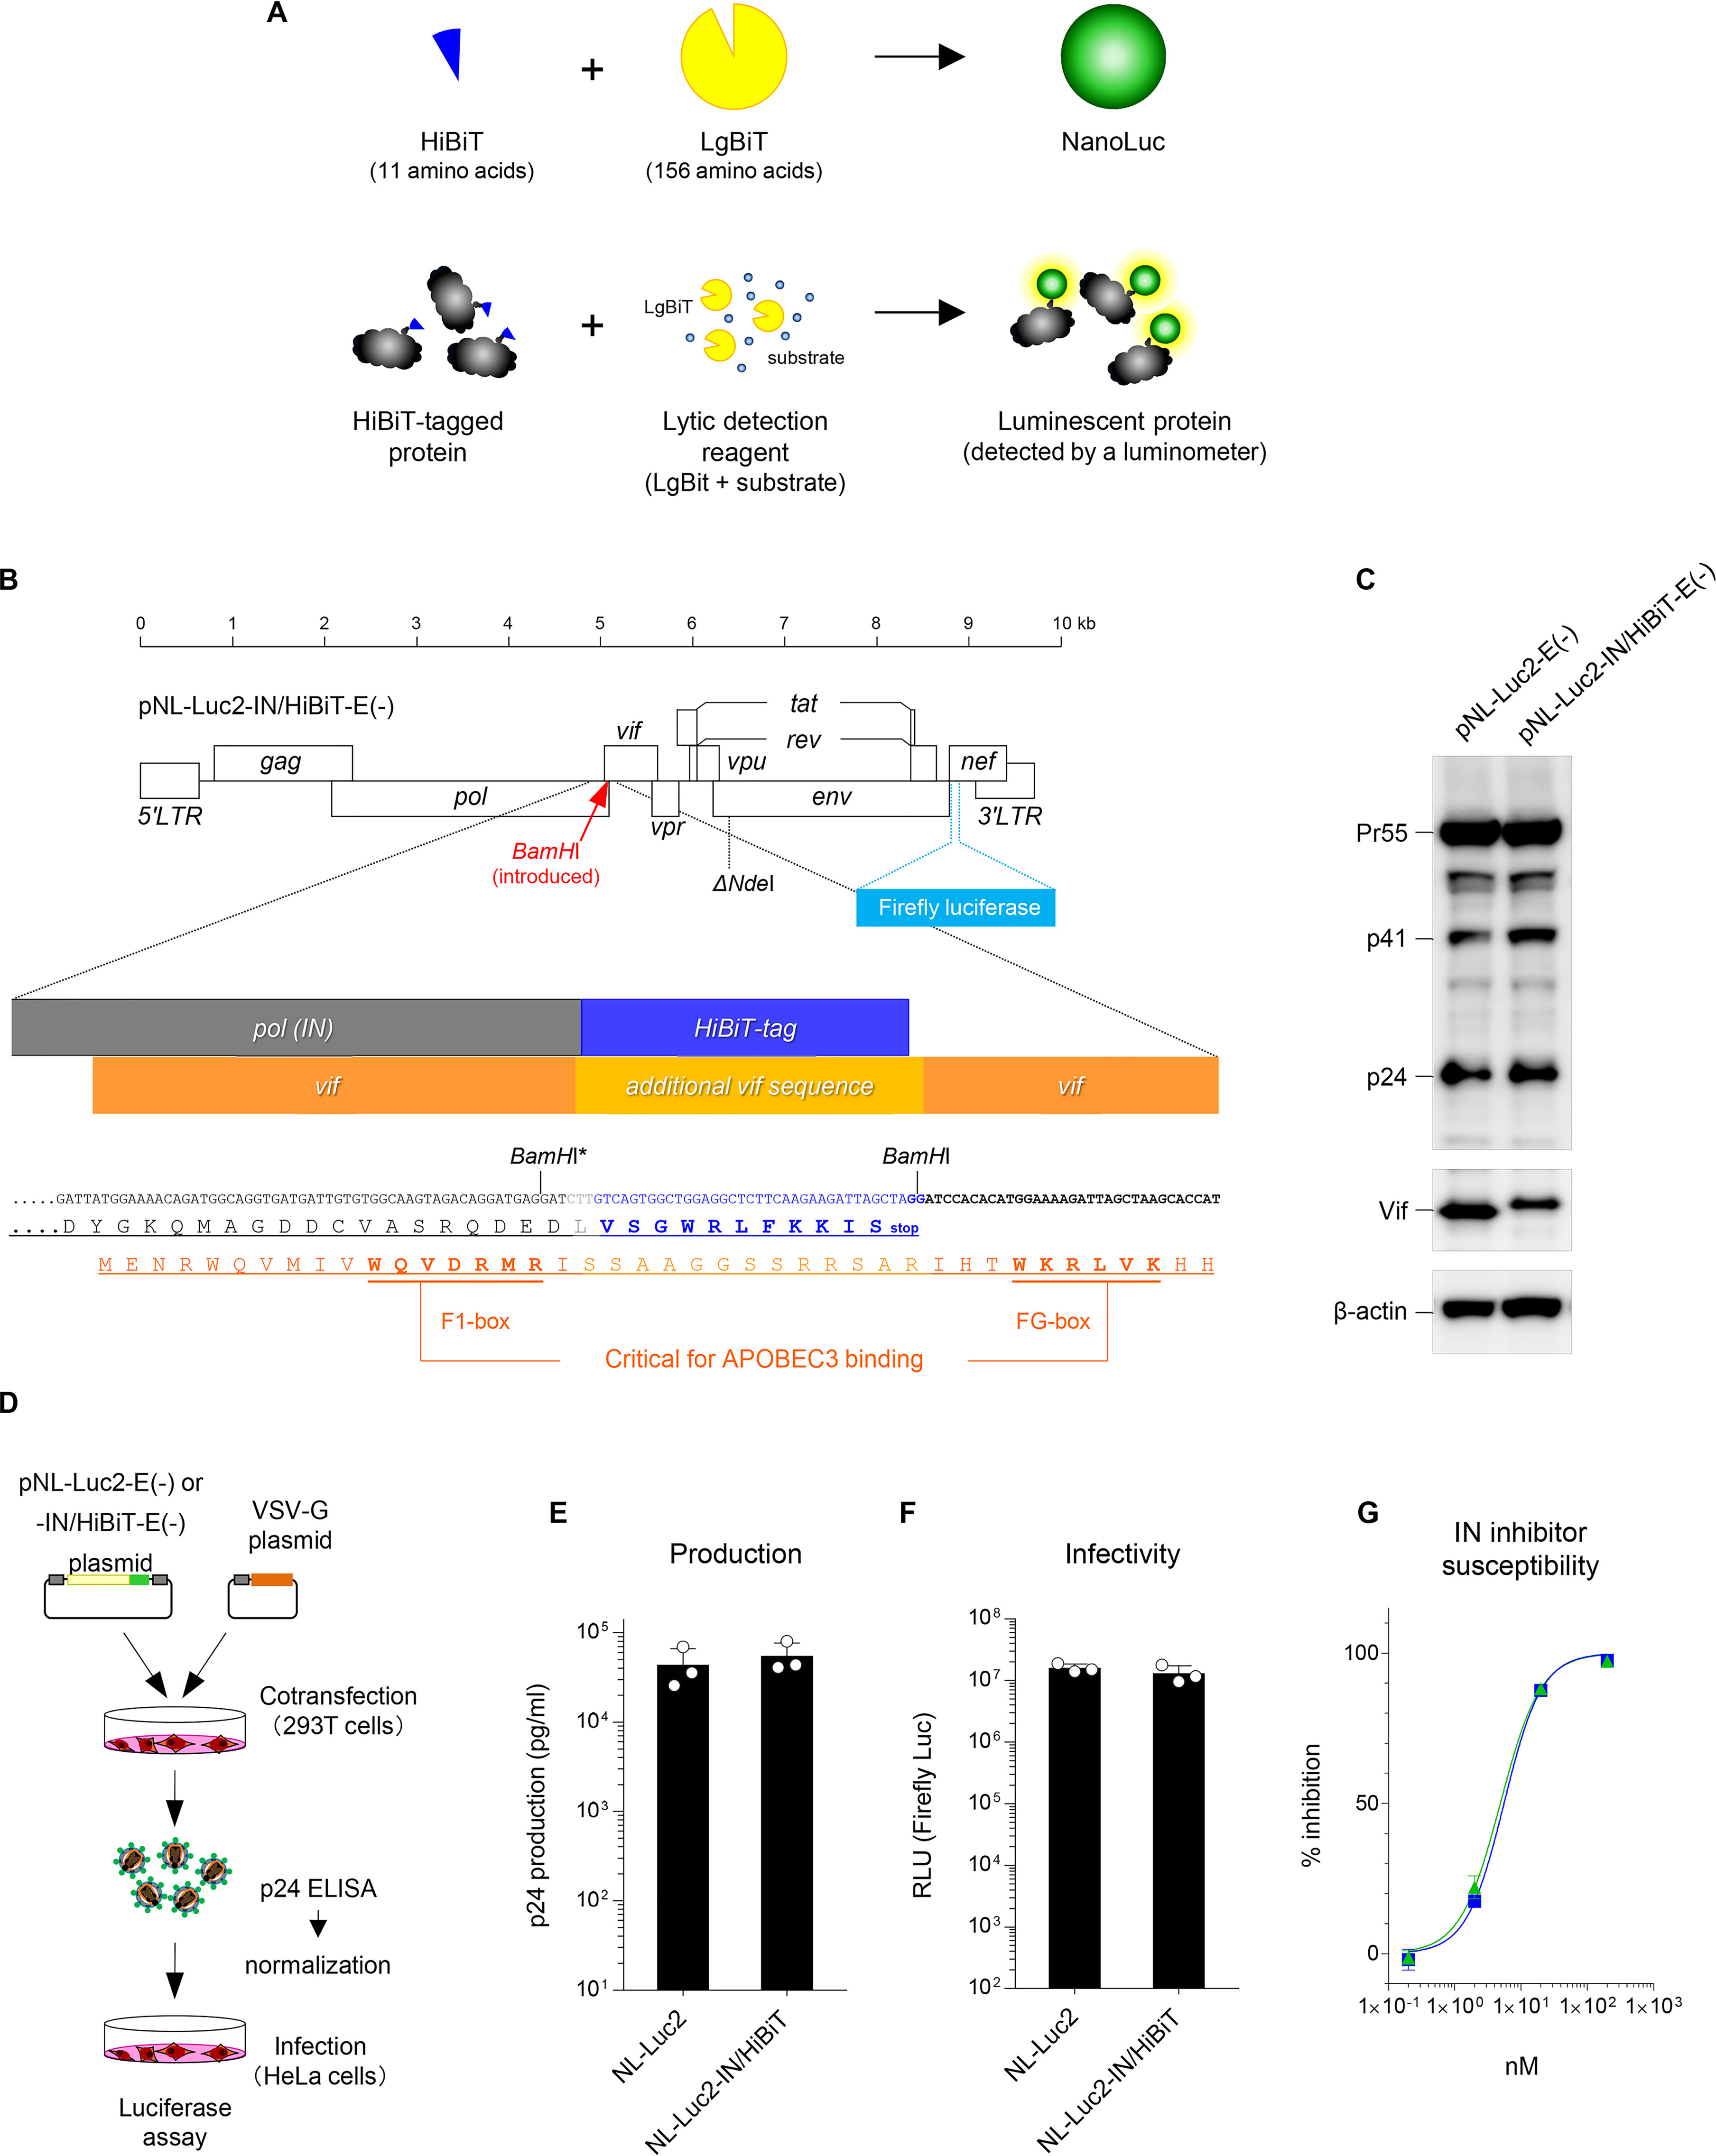
Figure 1.

Luciferase reporter HIV-1 proviral DNA with a HiBiT tag maintains the expected levels of production, infectivity, and susceptibility to the IN inhibitor. A, schematic diagram of the HiBiT luciferase assay system (adapted from Promega). B, construction of the HiBiT-tagged HIV-1 proviral DNA designated pNL-Luc2-IN/HiBiT-E(−). An HiBiT tag (11 amino acid sequence shown in blue) was inserted into the C terminus of the integrase of pNL-Luc2-E(−) in which BamHI was newly introduced (the upstream BamHI site with an asterisk was disrupted by inserting the HiBiT tag). The amino acid sequence shown in light orange represents the vif gene with an unrelated sequence created by the HiBiT tag insertion. C, Western blot analysis performed by using extracts from 293T cells transfected with either pNL-Luc2-E(−) or pNL-Luc2-IN/HiBiT-E(−). Antibodies specific for p24 (upper), Vif (middle), and β-actin (lower) were used. Data shown are representative of two independent experiments. D, schematic flowchart of the experimental procedure for HIV-1 virion production and infectivity assays. 293T cells were transfected with either pNL-Luc2-E(−) or pNL-Luc2-IN/HiBiT-E(−) together with pC-VSVg, and 48 h later, the viral supernatants were harvested and subjected to HIV-1 p24 ELISA to determine the level of virion production. Transfection efficiencies were normalized to the activity of firefly luciferase. Equivalent amounts of p24 antigen of VSV-G-pseudotyped viruses were used for the infection of HeLa cells. After 48 h, cells were lysed, and firefly luciferase activities were measured to determine viral infectivity. E and F, comparison of virion production (E) and viral infectivity (F) of NL-Luc2 and NL-Luc2-IN/HiBiT viruses (mean ± S.D. from three independent experiments). RLU, relative light units. G, susceptibility of NL-Luc2 (blue square) and NL-Luc2-IN/HiBiT (green triangle) viruses to the integrase inhibitor dolutegravir. Data from two independent experiments are shown as percent inhibition (mean ± S.D., n = 3 technical replicates). Image prepared based on Promega Corporation product information, with permission.
