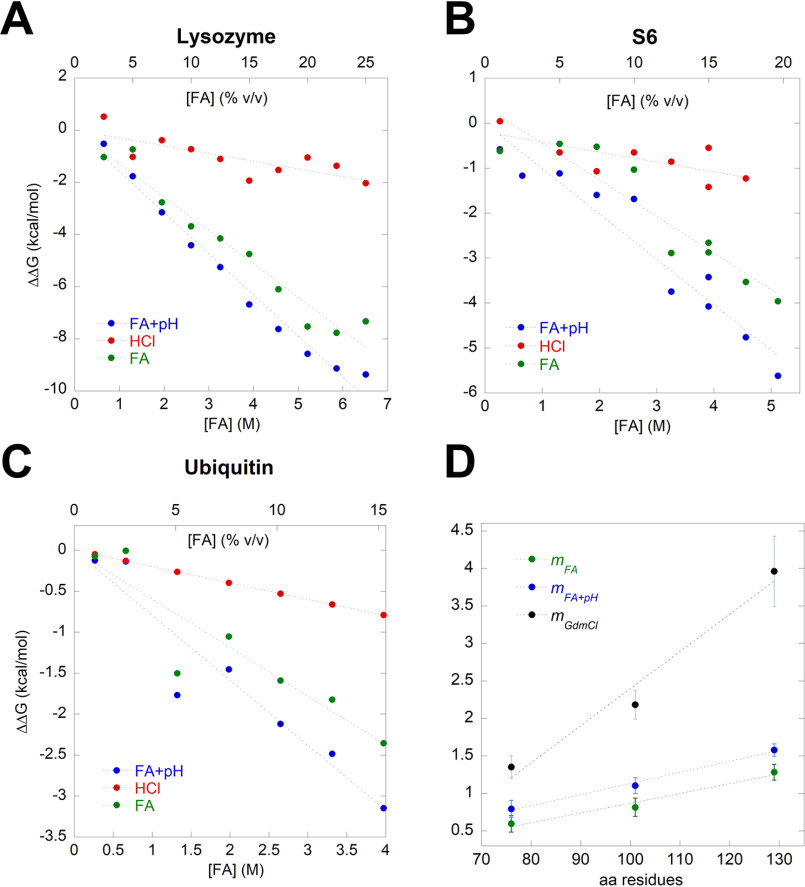
Figure 5.
Correlation between the change in the free energy of unfolding ΔΔGD-N and FA concentration (blue), HCl (red), and HCl-subtracted effect of FA (green) of lysozyme (A), S6 (B), and ubiquitin (C). D, the m values found in panels A–C are plotted versus the number of residues of the model proteins. These FA-based m values can be compared to m values for the same three proteins in GdmCl, resulting in a slope that is 3–4 times more steep for GdmCl reflecting FA's comparatively lower strength as a denaturant.

