Figure 1.
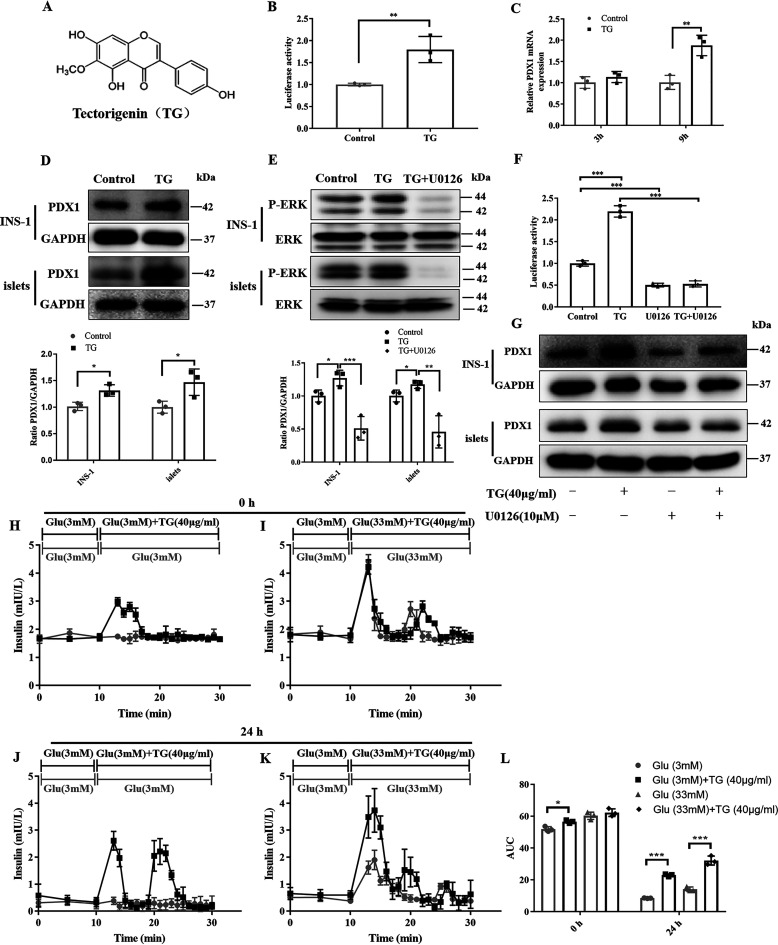
TG increases PDX1 expression by activating ERK signaling and potentiates the insulin secretion of mice islets. A, the chemical structure of TG. B, luciferase activities of PGL3-PDX1-luc–transfected HEK293T cells treated with or without TG (40 µg/ml) for 24 h. Results are expressed as the fold-induction (over the activity of the negative control). C, RT-qPCR analysis of mRNA levels of PDX1 in INS-1 cells untreated or treated with 40 µg/ml of TG for 3 or 9 h. D, Western blotting analysis of PDX1 protein in INS-1 cells or islets untreated or treated with 40 µg/ml of TG for 24 h. E, Western blotting analysis of P-ERK levels in INS-1 cells or islets treated with 40 µg/ml of TG in the presence or absence of 10 μm U0126 for 10 min. F, luciferase activities of PGL3-PDX1-luc–transfected HEK293T cells treated with U0126, TG, or in combination for 24 h. Results are reported as a mean ± S.D. of fold-induction (the luciferase activity of TG, U0126, or combined treatment divided by the relative luciferase activity of control). G, Western blotting analysis of PDX1 levels in INS-1 cells or islets treated with TG, U0126, or a combination for 24 h. H–L, perifusion secretion assay of native mouse islets. Islets were perfused immediately after isolation with Ca5 buffer containing 3 mm glucose for 10 min, which were then changed to 3 mm glucose plus TG (H), 33 mm glucose Ca5 buffer or 33 mm glucose Ca5 buffer plus TG (I) for another 20 min. Otherwise, isolated islets were pretreated with TG (40 μg/ml) for 24 h before perifusion. Pretreated islets were perfused with 3 mm glucose for 10 min, which were then changed to 3 mm glucose plus TG (J), 33 mm glucose Ca5 buffer, or 33 mm glucose Ca5 buffer plus TG (K) for another 20 min. L, the area under the curve was calculated for the glucose-stimulated insulin secretion in H–L. Data are expressed as the mean ± S.D. of each experiment in triplicate. Image J was used for quantitative analysis. Error bars indicate S.D. (n = 3 biologically independent samples). *, p < 0.05; **, p < 0.01; ***, p < 0.001 versus the control group.

