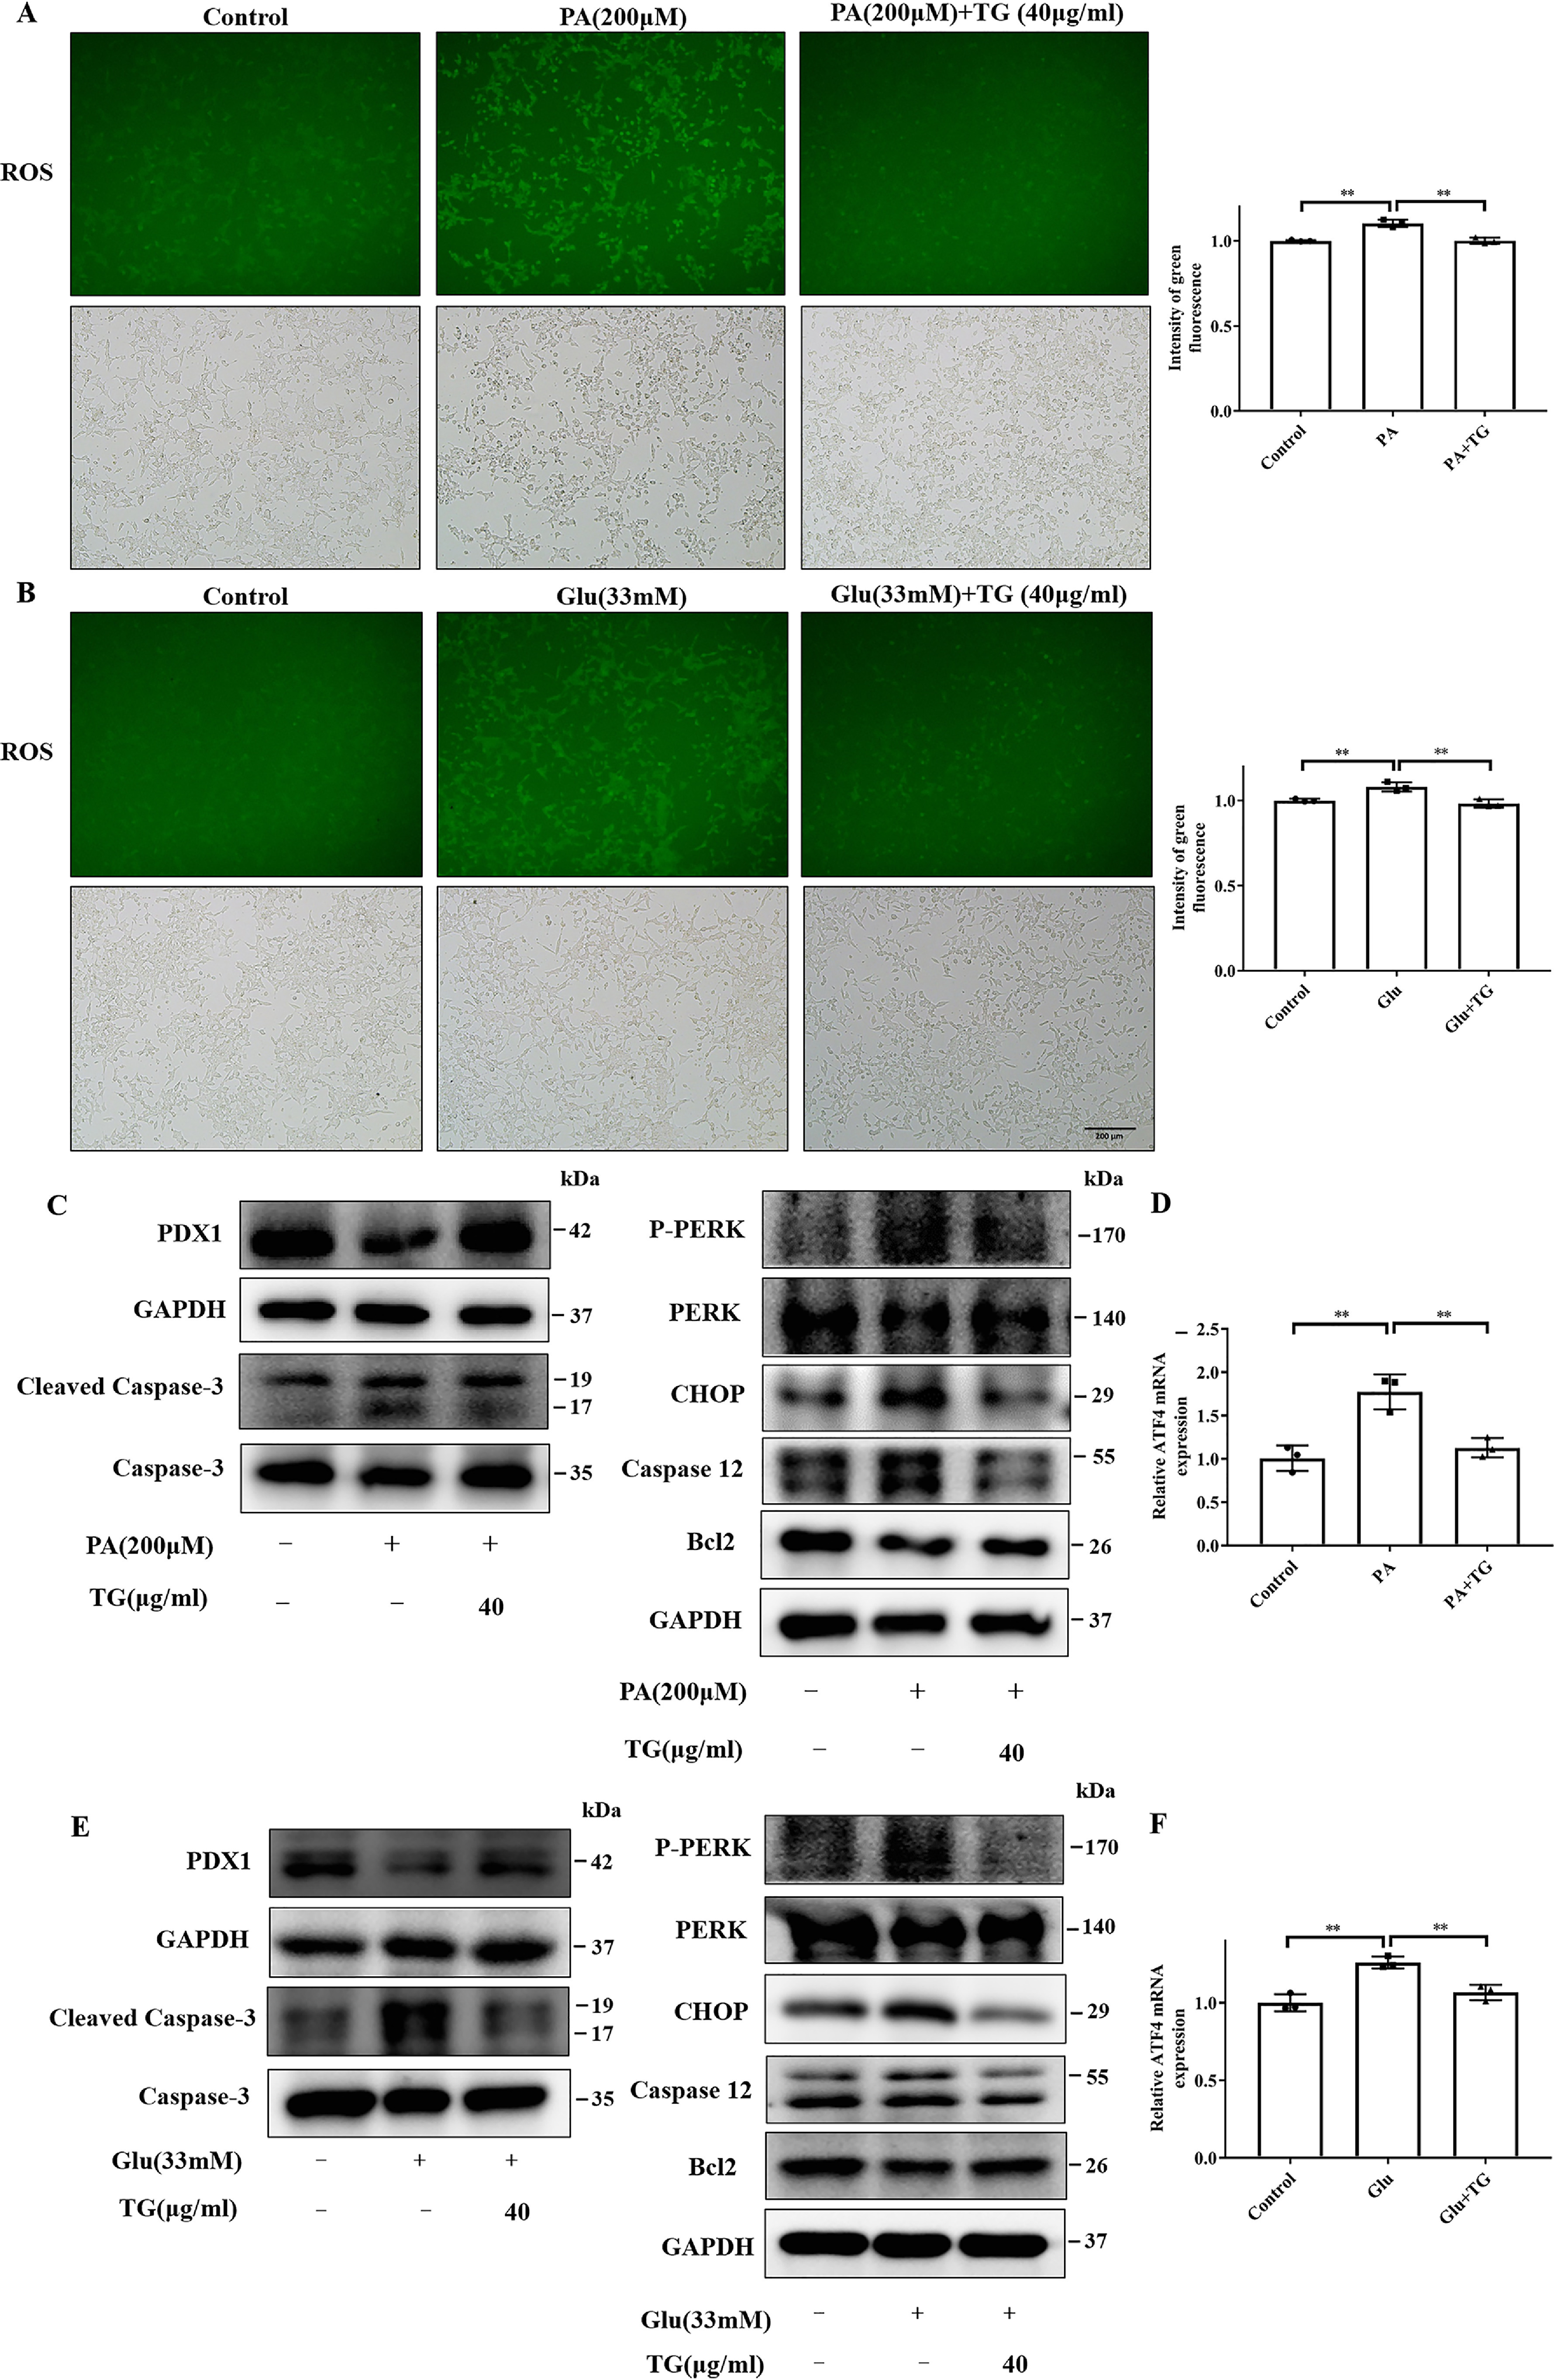
Figure 3.

TG decreases ROS levels and prevents ER stress in INS-1 cells exposed to PA or glucose. A and B, effects of TG on the levels of ROS in INS-1 cells exposed to 200 μm PA for 24 h (A) or 33 mm glucose for 72 h (B). Intracellular ROS fluorescence images were analyzed using a fluorescence microscope; the intensity of green fluorescence was used to assess ROS production. C–F, effects of TG on the levels of ER stress markers in INS-1 cells exposed to 200 μm PA for 24 h (C and D) or 33 mm glucose for 72 h (E and F). P-PERK, CHOP, caspases-12, and anti-apoptotic signal Bcl2 were tested by Western blotting (C and E). The mRNA levels of ATF4 were evaluated with RT-qPCR (D and F). **, p < 0.01 versus the control group.
