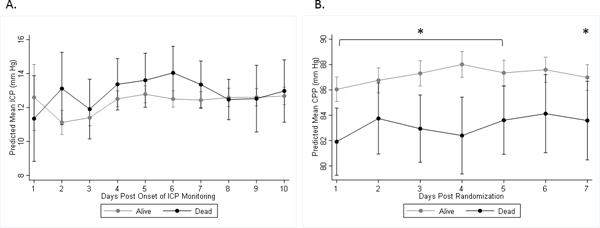
Figure 1.

A, Mean of maximum daily ICP readings (with 95% CIs). B, Mean of minimum daily CPP readings (with 95% CIs). Maximum daily ICP was not significantly different between survivors and non-survivors at day 30. Minimum daily CPP was significantly lower in non-survivors versus survivors on days 1–5 and 7 (*:p<0.05). The slopes between groups are not different; however, the slope for ICP in survivors is significantly different from zero (p<0.001).
