Figure 2. Coordinated transcriptomic responses with sleep need indicate a role for MEF2C.
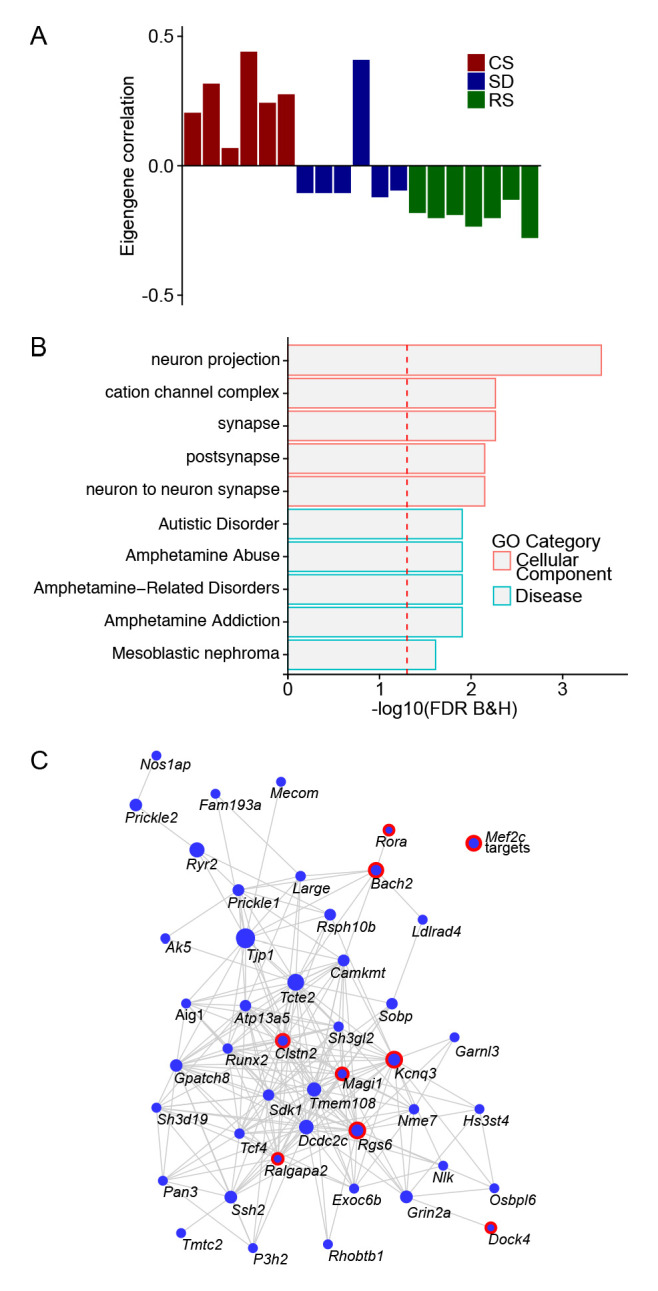
(A) Heatmap showing enrichment of sleep-state DEGs across modules of genes identified by weighted gene co-expression network analysis (WGCNA). First three rows show module eigengene correlation to sleep states (CS, SD and RS respectively) ordered by most positive to most negative correlation to CS sleep state. The following four rows highlight the significance of module enrichment for a specific set of DEGs colored by green for genes with decreased expression for CSxSD, CSxRS, SDxRS and MEF2C targets (Harrington et al., 2016) and the next four rows colored by red to highlight the significance of module enrichment for genes with increased expression for CSxSD, CSxRS, SDxRS and MEF2C targets (Harrington et al., 2016). The bottom four rows colored by shades of orangeyellow show enrichment of modules for cell types identified using single-cell RNA sequencing (Hrvatin et al., 2018) from mouse cortex. Each column is a module of genes as indicated by the module ID in last row. (B) Barplot for a selected module (Module ID 04) with eigengene correlation across sleep states showing a strong positive correlation to CS and negative correlation to SD and weak negative correlation to RS. (C) Network plot for selected module (Module ID 04) showing the top 250 connections between genes. Genes that are MEF2C targets (Harrington et al., 2016) are highlighted by red circles. (D) GO plot for genes within the selected module (Module ID 04).

Figure 2—figure supplement 1. A module of gene co-expression characterized by an eigengene driven by sleep condition.