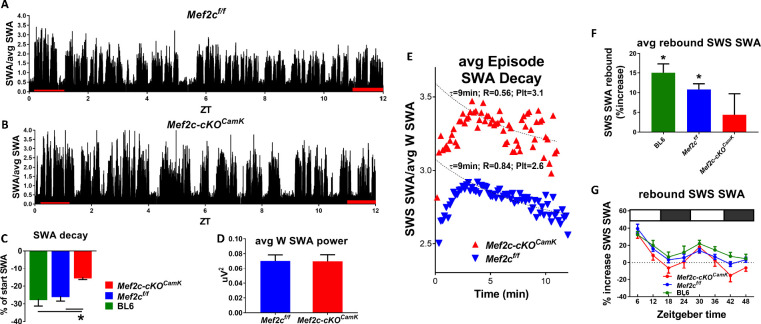
Figure 5. Loss of Mef2c increases sleep need and decreases its resolution.
(A) SWA power (normalized to average SWA power over 24 hr) declines over the light phase as shown in a Mef2cf/f mouse. (B) The decline is less apparent in an example from a Mef2c-cKOCamk2a-Cre mouse. (C) Pooled data (Mef2cf/f, n = 6; Mef2c-cKOCamk2a-Cre, n = 11; C57BL/6, n = 6) SWA power decay over the light phase for WT (BL/6), Mef2cf/f and Mef2c-cKOCamk2a-Cre. (D) The average waking SWA power in 24 hr is similar for Mef2c-cKOCamk2a-Cre and Mef2cf/f and is used as a normalizing factor to assess averaged SWS episode power. (E) SWS-SWA power over time from an average of SWS episodes aligned from the time of transition from waking to SWS, set to t = 0. The time constant of decay, τ = 8.4 min, was calculated by best fit of the decay of power for the Mef2cf/f but the decay fit was indeterminate for Mef2c-cKOCamk2a-Cre (see Materials and methods section for details). By setting τ = 8.4 min, a best fit to single exponential decay provided a plateau value (minimal value), an extrapolated peak value and an indication of goodness of fit in comparison to Mef2cf/f. The SWS-SWA power for Mef2c-cKOCamk2a-Cre mice is greater than Mef2cf/f as determined by the plateau value (Plt) and the peak value. The quality of the fit is reduced as indicated by the R2 value. (F) The average SWS-SWA power of each genotype following repeated, regular bouts of 4 hr SD, was significantly increased compared to SWS-SWA power under baseline conditions. Mef2c-cKOCamk2a-Cre mice failed to show this rebound response to sleep loss. (G) The time course of rebound across the 8 × 4 hr SD periods indicates that the lack of rebound in Mef2c-cKOCamk2a-Cre is particularly prominent during the dark phase.


