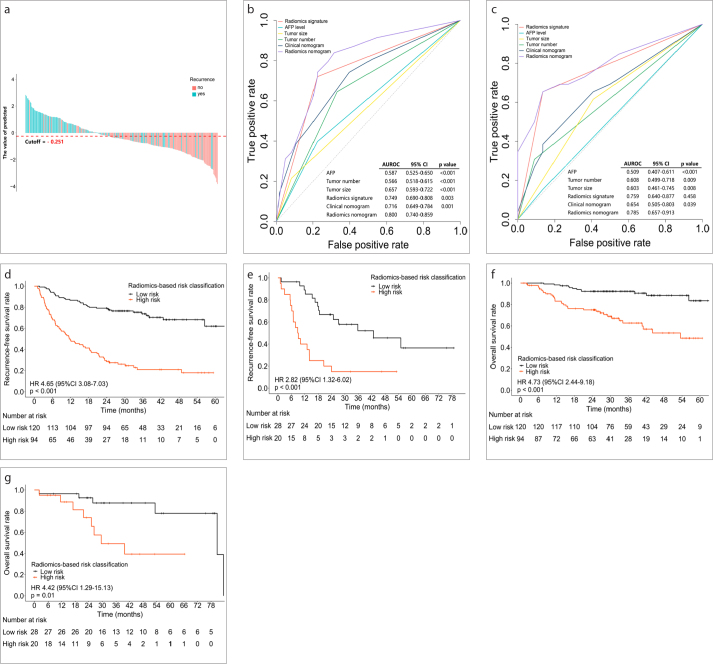
Figure 4. a–g.
Predictive performance of the radiomics signature. Panel (a) shows radiomics signature scores for each patient in the training and validation cohorts. The turquoise-colored bars show scores for patients with early recurrence, and the red-colored bars show scores for patients without early recurrence. Panels (b, c) show receiver operating characteristic curves to compare the sensitivity and specificity of the constructed models (containing dichotomized radiomics signature scores; clinical nomogram, including AFP, tumor number and tumor size; and radiomics-based nomogram, including AFP, tumor number, tumor size, and dichotomized radiomics signature) and clinical variables for prediction of early recurrence (panel (b), training cohort; panel (c), validation cohort). The Hosmer–Lemeshow test was used to compare the difference between the radiomics-based nomogram and the other models. Radiomics signature = Dichotomized radiomics signature. Panels (d, e) show Kaplan–Meier curves of recurrence-free survival according to the dichotomized radiomics signature scores (panel (d), training cohort; panel (e), validation cohort). Panels (f, g) show Kaplan-Meier curves of overall survival according to the dichotomized radiomics signature scores (panel (f), training cohort; panel (g), validation cohort).

