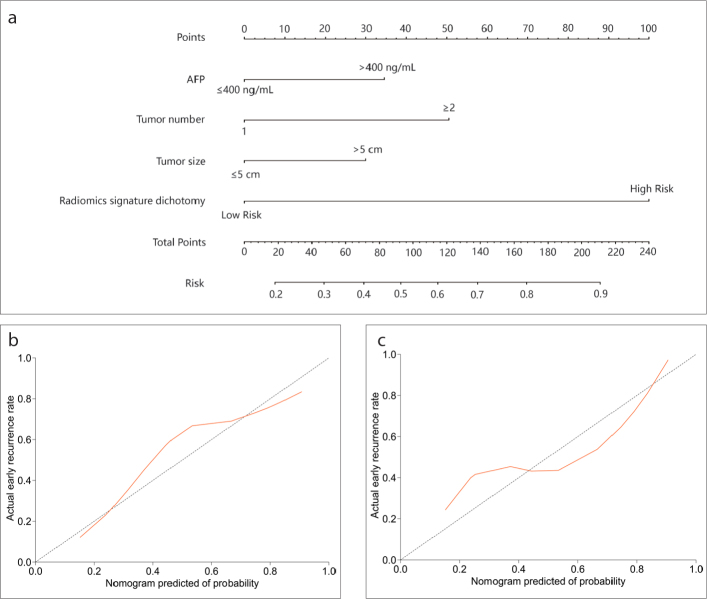
Figure 5. a–c.
Developed nomogram and calibration curves of the nomogram. Panel (a) shows the nomogram developed to predict the risk of early recurrence in patients with hepatocellular carcinoma who underwent resection with curative intent (including AFP, tumor number, tumor size, and dichotomized radiomics signature). Panels (b, c) show the calibration curves of the radiomics-based nomogram, which was used to depict the calibration of each model in terms of the agreement between the predicted risks of early recurrence and observed outcomes of early recurrence. The y-axis represents the actual early recurrence, and the x-axis represents the predicted risk of early recurrence. The diagonal dotted line represents perfect prediction by an ideal model. The red-colored solid line represents the performance of the nomogram; a closer fit to the diagonal dotted line represents better predictive performance (panel (b), training cohort; panel (c), validation cohort).

